Download
1 / 16
160 likes | 251 Vues
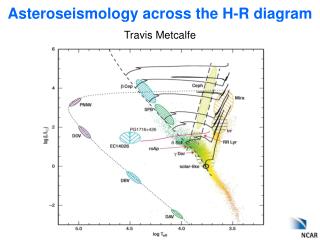
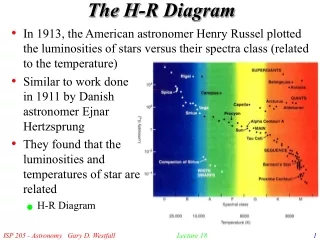
H-R Diagram Jan 9, 2013 Lecture (A). HERTZSPRUNG–RUSSELL DIAGRAM. The relationship between the luminosities and temperatures of stars was discovered early in the twentieth century by two independent astronomers.

E N D
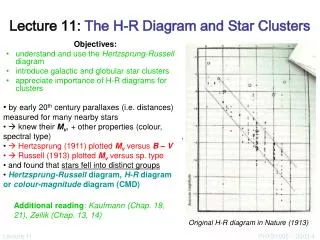
HERTZSPRUNG–RUSSELL DIAGRAM • The relationship between the luminosities and temperatures of stars was discovered early in the twentieth century by two independent astronomers. • Henry N. Russell (1877–1957) of the U.S. and Ejnar Hertzsprung (1893–1967) of Denmark. • The Hertzsprung–Russell (H–R) diagram is a plot of luminosity versus temperature. • Astronomers use the H–R diagram widely to check their theories
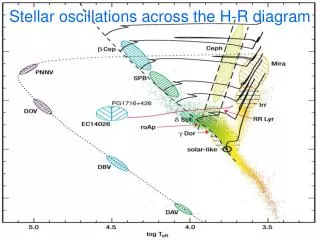
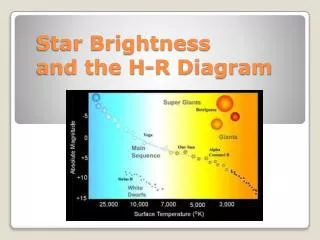
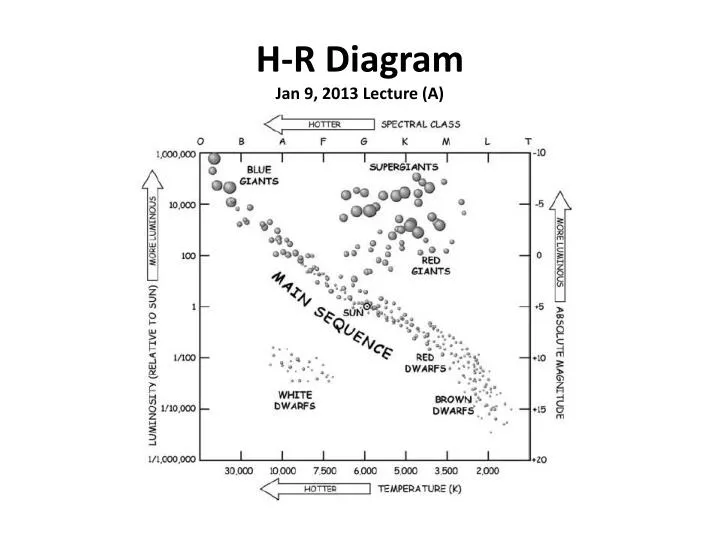
Every dot on an H–R diagram represents a star whose temperature (spectral-class) is on the horizontal axis (x) and whose luminosity (absolute magnitude) is on the vertical axis (y). • When stars are chosen at random and plotted on the H–R diagram, they fall into definite regions. • This pattern indicates a relationship between a star’s luminosity and its temperature
About 90%of the stars lie along a band called the main sequence (H-fuel tank). • It runs from the upper left (hot, bright blue giants) to the lower right (cool, faint dwarfs). • Red dwarfs are the most common type of stars (as are dwarf planets-Pluto). Most of the other 10 %of stars fall into the upper right region (cool, bright giants and supergiants) or in the lower left corner (hot, low-luminosity white dwarfs).
Identify the location of the following stars indicated on the H–R diagram in Figure below. Each star’s absolute magnitude is given in parentheses. Refer to the chart for temperature and spectral class. (a) Rigel (–6.6) __________ ; (b) Vega (0.6) __________ ; (c) Sun (4.8) __________ ; (d) Betelgeuse (–5.0) __________ ; (e) Barnard’s Star (13.2) __________ ; (f ) Sirius B (11.3) __________
MASS-LUMINOSITY RELATION The luminosity of a star is approximately proportional to its mass raised to the 3.5 power. L ~ mass3.5 • A star’s position on the main sequence is determined by its mass, or the amount of matter the star contains. • The main sequence is a sequence of stars of decreasing mass, from the most massive, most luminous stars at the upper end to the least massive, least luminous stars at the lower end. • An empirical mass–luminosity relation for main sequence stars, found from binary stars, says that the more massive a star is, the more luminous it
The mass of the Sun, M°. = 2 × 1030 kg, is practically 333,000 times the mass of Earth. • Stellar masses do not vary enormously along the main sequence as stellar luminosities do. • The faintest red dwarfs have a mass about one tenth of the Sun’s. • A gas object with a mass between 0.01Mo and 0.1Mo is called a brown dwarf, may shine briefly but is too small to get hot enough to become a star. • The largest mass of a stable star is about 60Moto 75Mo What basic property of a star determines its position on the main sequence of the H–R diagram; that is, what determines its luminosity and temperature? _____________________ ---------------------------------------------------------------------------------------- Star A: Mass = 0.05Mo, Star B: Mass = 80Mo, Star C: = 62Mo Fill-in the boxes Stable Star _____ Unstable Star _____ Brown Dwarf _____
Our Sun is the only star that is close enough to allow astronomers to measure its size directly. • The diameter of the Sun is 1.39 million km (about 864,000 miles). That is equal to 109 Earths. • Luminosity (L) of a star is proportional to the square of its radius (R) times the fourth power of its surface temperature (T). • L ~ R2T4 • Stars on the main sequence vary in size continuously from the large blue-white giants, about 25 times the Sun’s radius (R°) • Cool red dwarfs are only about 0.1Rothe Sun’s radius. • The largest stars are the supergiants such as Betelgeuse in Orion, whose radius is about 400Ro. • You could fit more than a million stars like our Sun inside Betelgeuse! • The smallest common stars are the white dwarfs, roughly the size of Earth. • The mean density, or the mass per unit volume, of the Sun is 1.4 g/cm3, slightly more than that of water, 1 g/cm3 . • Red giant stars and white dwarf stars both have about the same mass as the Sun but are very different sizes.
What can you say about the densities of red giants and white dwarfs compared to the Sun? Red Giant’s mass being transferred to the white dwarf Type 1A Super Nova
DOUBLE STAR SYSTEMS • Many stars that look single to the unaided eye are not. A binary star is formed by a pair of stars that revolve around a common center of gravity as they travel through space together. • The masses of the stars can be figured from the angular size and period of their orbits. • Binary stars are classified by the way they are observed
A visual binary can be resolved with a telescope so that two separate stars can be seen. • Over 70,000 visual binaries are known. Mizar in Ursa Major was the first binary star discovered, in 1650. • Beautiful Albireo in Cygnus is a colorful yellow and blue star. You can see these and many others in a small telescope.
An astrometric binary is a visible star plus an unseen companion star. The presence of an unseen companion is inferred from variable proper motion of the visible star. • Brilliant Sirius (Sirius A) in Canis Major was an astrometric binary from 1844, when its nature was detected, until 1862. Then its faint companion star (Sirius B) was observed.
spectroscopic binary cannot be resolved in a telescope. Its binary nature is revealed by its spectrum. • A varying Doppler shift is apparent in the spectral lines as the stars approach and recede from Earth. • Almost a thousand spectroscopic binaries have been analyzed. The brighter member of Mizar (Mizar A) is a spectroscopic binary
An eclipsing binary is situated so that one star passes in front of its companion, cutting off light from our view at regular intervals. • An eclipsing binary regularly changes in brightness. You can see the famous eclipsing binary Algol, the Demon, in Perseus. • Algol “winks” from brightest magnitude 2.2 to least bright magnitude 3.5 in about 2 days and 21 hours
optical double is a pair of stars that appear to be close to each other in the sky when viewed from Earth. • Actually, one is much more distant than the other, and they have no physical relationship to one another. • Test your eyesight by finding both Mizar and Alcor (nicknamed “the testers”), the optical double in the handle of the Big Dipper in Ursa Major. How does an optical double differ from a visual binary?