Download
1 / 47
470 likes | 477 Vues
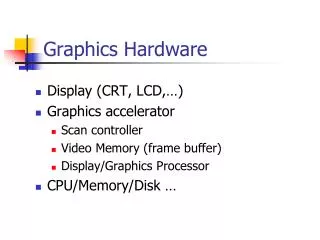
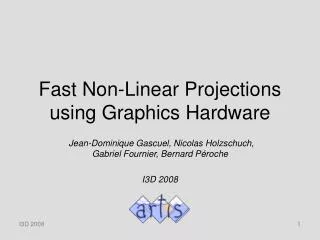
Fast Computation of Generalized Voronoi Diagrams Using Graphics Hardware Kenneth E. Hoff III, Tim Culver, John Keyser, Ming Lin, and Dinesh Manocha University of North Carolina at Chapel Hill SIGGRAPH ‘99. What is a Voronoi Diagram?.

E N D
Fast Computation of Generalized Voronoi Diagrams Using Graphics Hardware Kenneth E. Hoff III, Tim Culver, John Keyser, Ming Lin, and Dinesh Manocha University of North Carolina at Chapel Hill SIGGRAPH ‘99
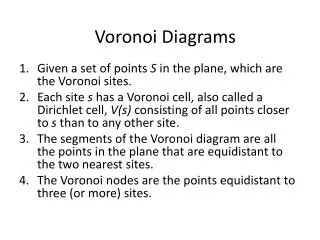
What is a Voronoi Diagram? Given a collection of geometric primitives, it is a subdivision of space into cells such that all points in a cell are closer to one primitive than to any other Voronoi Site Voronoi Region
Generalized • Higher-order site geometry • Varying distance metrics Ordinary • Point sites • Nearest Euclidean distance Higher-orderSites 2.0 0.5 Weighted Distances
Why Should We Compute Them? It is a fundamental concept Descartes Astronomy 1644 “Heavens” Dirichlet Math 1850 Dirichlet tesselation Voronoi Math 1908 Voronoi diagram Boldyrev Geology 1909 area of influence polygons Thiessen Meteorology 1911 Theissen polygons Niggli Crystallography 1927 domains of action Wigner & Seitz Physics 1933 Wigner-Seitz regions Frank & Casper Physics 1958 atom domains Brown Ecology 1965 areas potentially available Mead Ecology 1966 plant polygons Hoofd et al. Anatomy 1985 capillary domains Icke Astronomy 1987 Voronoi diagram
Why Should We Compute Them? Useful in a wide variety of applications Collision Detection Surface Reconstruction Robot Motion Planning Non-Photorealistic Rendering Surface Simplification Mesh Generation Shape Analysis
What Makes Them Useful? “Ultimate” Proximity Information Nearest Site Maximally Clear Path Density Estimation Nearest Neighbors
Outline • Generalized Voronoi Diagram Computation • Exact and Approximate Algorithms • Previous Work • Our Goal • Basic Idea • Our Approach • Basic Queries • Applications • Conclusion
Generalized Voronoi Diagram Computation“Exact” Algorithms • Previous work • Lee82 • Chiang92 • Okabe92 • Dutta93 • Milenkovic93 • Hoffmann94 • Sherbrooke95 • Held97 • Culver99 Computes Analytic Boundary
Previous Work: “Exact” Algorithms • Compute analytic boundaries but... • Boundaries composed of high-degree curves and surfaces and their intersections • Complex and difficult to implement • Robustness and accuracy problems
Generalized Voronoi Diagram Computation Approximate Algorithms Exact Algorithm Analytic Boundary Discretize Sites Discretize Space Previous work Lavender92, Sheehy95, Vleugels 95 & 96, Teichmann97
Previous Work: Approximate Algorithms • Provide practical solutions but... • Difficult to error-bound • Restricted to static geometry • Relatively slow
Our Goal • Simple to understand and implement • Easily generalized • Efficient and practical Approximate generalized Voronoi diagram computation that is: with all sources of error fully enumerated
Outline • Generalized Voronoi Diagram Computation • Basic Idea • Brute-force Algorithm • Cone Drawing • Graphics Hardware Acceleration • Our Approach • Basic Queries • Applications • Conclusion
Brute-force Algorithm Record ID of the closest site to each sample point Coarsepoint-samplingresult Finerpoint-samplingresult
Cone Drawing To visualize Voronoi diagram for points in 2D… Perspective, 3/4 view Parallel, top view Dirichlet 1850 & Voronoi 1908
Graphics Hardware Acceleration Simply rasterize the cones using graphics hardware Our 2-part discrete Voronoidiagram representation Color Buffer Depth Buffer Site IDs Distance Haeberli90, Woo97
Outline • Generalized Voronoi Diagram Computation • Basic Idea • Our Approach • Meshing Distance Function • Generalizations • 3D • Sources of Error • Basic Queries • Applications • Conclusion
The Distance Function Evaluate distance at each pixel for all sitesAccelerate using graphics hardware Point Line Triangle
Approximating the Distance Function Avoid per-pixel distance evaluationPoint-sample the distance functionReconstruct by rendering polygonal mesh Point Line Triangle
The Error Bound Error bound is determined by the pixel resolution farthest distance a point can be from a pixel sample point Close-up of pixel grid
Meshing the Distance Function Shape of distance function for a 2D point is a cone Need a bounded-error tessellation of the cone
Shape of Distance Functions Sweep apex of cone along higher-order site to obtain the shape of the distance function
Curves Tessellate curve into a polylineTessellation error is added to meshing error
Weighted and Farthest Distance Nearest Weighted Farthest
3D Voronoi Diagrams Graphics hardware can generate one 2D slice at a time Point sites
3D Voronoi Diagrams Slices of the distance function for a 3D point site Distance meshes used to approximate slices
3D Voronoi Diagrams Point Line segment Triangle 1 sheet of a hyperboloid Elliptical cone Plane
3D Voronoi Diagrams Points and a triangle Polygonal model
Sources of Error • Distance Error • Meshing • Tessellation • Hardware Precision • Combinatorial Error • Distance • Pixel Resolution • Z-buffer Precision
Adaptive Resolution Zoom in to reduce resolution error...
Outline • Generalized Voronoi Diagram Computation • Basic Idea • Our Approach • Basic Queries • Nearest Site • Boundary Finding • Nearest-Neighbor Finding • Maximally Clear Point • Applications • Conclusion
Nearest Site Table lookup on query point
Boundary Finding • Isosurface extraction : boundary walking • Offset difference image to mark boundary pixels
Nearest-Neighbor Finding • Which colors touch in the image? • Walk the boundaries (like boundary finding)
Maximally Clear Point Point with the largest depth value (greatest distance)
Outline • Generalized Voronoi Diagram Computation • Basic Idea • Our Approach • Basic Operations • Applications • Motion Planning • Medial Axis Computation • Dynamic Mosaics • Conclusion
Real-time Motion Planning : Static Scene Plan motion of piano (arrow) through 100K triangle model Distance buffer of floorplan used as potential field
Real-time Motion Planning : Dynamic Scene Plan motion of music stand around moving furniture Distance buffer of floor-plan used as potential field
Medial Axis Computation Per-featureVoronoi diagram Per-feature-colordistance mesh Internal Voronoi diagram
Dynamic Mosaics 1000 moving points Source image Dynamic Mosaic Tiling Static mosaics by Paul Haeberli in SIGGRAPH ‘90
Outline • Generalized Voronoi Diagram Computation • Basic Idea • Our Approach • Basic Operations • Applications • Conclusion
Conclusion Meshing Distance Functions Graphics Hardware Acceleration Brute-force Approach + Fast and Simple, Approximate Generalized Voronoi Diagrams Bounded Error
Future Work • Improve distance meshing for 3D primitives • More applications • Motion planning with more degrees of freedom • Accelerate exact Voronoi diagram computation • Surface reconstruction • Medical imaging: segmentation and registration • Finite-element mesh generation
Acknowledgements Sarah Hoff Chris Weigle Stefan Gottschalk Mark Peercy UNC Computer Science SGI Advanced Graphics Berkeley Walkthrough Group
Acknowledgements Army Research Office National Institute of Health National Science Foundation Office of Naval Research Intel