Download

1 / 17
170 likes | 262 Vues
Statistical Object Features. Jin, Tao. Introduction. We have modified the image from the lowest level of pixel data into higher-level representations, using image segmentation and transforms. Image segmentation allows us to look at object features.

E N D
Statistical Object Features Jin, Tao
Introduction • We have modified the image from the lowest level of pixel data into higher-level representations, using image segmentation and transforms. • Image segmentation allows us to look at object features. • Object features include the geometric properties of binary objects, histogram features, and color features.
Geometric Object features • To extract object features, we need an image that has undergone image segmentation and any necessary morphological filtering. This will provide us with clearly defined objects, which can then be labeled and processed independently. • Labeled image is used to extract the features of interest. • The binary object features include area, center of area, axis of least second moment, perimeter, Euler number, projections, thinness ratio, and aspect ratio. • Area, center of area, axis of least second moment, perimeter tell us something about where the object is. The other four tell about the shape of the objects.
Area • The area Ai is measured in pixels and indicates the relative size of the object. Ai = ΣΣ Ii(r,c) (0 <= r, c <= N-1) Where: Ii(r, c) = 1 if I(r,c) = ith object 0 otherwise
Center of area • We define the center of area for an object by the pair (ri, ci) ri = (ΣΣ rIi(r,c) )/Ai (0 <= r, c <= N-1) ci = (ΣΣ cIi(r,c) )/Ai (0 <= r, c <= N-1) (sum of the r,c value of all the pixels divides the number of pixels) • Theses correspond to the row coordinate of the center of area for the ith object ri, and the column coordinate of the center of area for the ith object ci. • This feature will help to locate an object in the two-dimensional image plan.
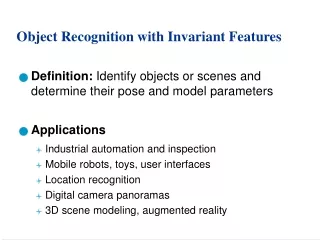
Axis of Least Second Moment • The axis of least second moment provides information about the the object’s orientation • This axis corresponds to the line about which it takes the least amount of energy to spin an object of like shape. • If we move the origin to the center of area (r,c), the axis of least second moment is defined as: tan(2θi) = 2 ΣΣrcIi(r,c)/(ΣΣr2Ii(r,c) - ΣΣc2Ii(r,c))
center c θ Axis of least second moment r Axis of Least Second Moment(2)
Perimeter • The perimeter of the object can help us to locate in in space and provide information about the shape of the object. • The perimeter can be found in the original binary image by counting the number of ‘1’ pixels that have ‘0’ pixels as neighbors. • Or it can be found by applying an edge detector to the object, followed by counting the ‘1’ pixels. Finding the ‘area’ of the border.
Matlab image processing toolbox provides the imfeature function stats=imfeature(L,measurements) L: labeled binary image Measurement: name of the features Output: struct array with fields. 80x1 struct array with fields: Area Centroid BoundingBox MajorAxisLength MinorAxisLength Eccentricity Orientation ConvexHull ConvexImage ConvexArea Image FilledImage FilledArea EulerNumber Extrema EquivDiameter Solidity Extent PixelList Matlab - imfeature
I=imread('rice.tif'); figure('Name', 'Original image'), imshow(I) I=im2double(I); bkg=blkproc(I, [32,32], 'min(x(:))'); bkg=imresize(bkg, [256,256], 'biliniear'); I2 = I - bkg; I2 = max(min(I2,1),0); I3 = imadjust(I2, [0 max(I2(:))], [0 1]); % apply thresholding to the image bw = I3>0.2; % label components [L, numObj] = bwlabel(bw, 4); map = hot(numObj+1); %create a colormap figure('Name', 'labeled binary image'), imshow(L+1, map); Experiment – Get labeled binary image
% Compute feature measurements of objects in the image FeatureData = imfeature(L, 'all'); FeatureData = 80x1 struct array with fields: Area Centroid BoundingBox MajorAxisLength MinorAxisLength Eccentricity Orientation ConvexHull ConvexImage ConvexArea Image FilledImage FilledArea EulerNumber Extrema EquivDiameter Solidity Extent PixelList Experiment – Extract object features
Array = [FeatureData.Area]; Min = min(Array); Max = max(Array); Mean = mean(Array); Std = std(Array); figure('Name', 'histogram for area'), hist(Array, 20); idx = find(Array < (Mean-Std)); L2 = ismember(L, idx); L2 = I.*L2; figure('Name', 'Objects below mean-std :area'), imshow(L2); idx = find(Array > (Mean+Std)); L2 = ismember(L, idx); L2 = I.*L2; figure('Name', 'Objects above mean+std :area'), imshow(L2); idx = find((Array < (Mean+Std)) & (Array > (Mean-Std))); L2 = ismember(L, idx); L2 = I.*L2; figure('Name', 'Objects between mean-std and mean+std :area'), imshow(L2); Experiment - Area
Array = [FeatureData.Centroid]; Array = reshape(Array, 2, numObj); Min = [min(Array(1,:)); min(Array(2,:))]; Max = [max(Array(1,:)); max(Array(2,:))]; Mean = [mean(Array(1,:)); mean(Array(2,:))]; Std = [std(Array(1,:)); std(Array(2,:))]; figure('Name', 'histogram for Centroid.row'), hist(Array(1,:), 20); figure('Name', 'histogram for Centroid.col'), hist(Array(2,:), 20); [row, col] = find( (Array(1,:) < (Mean(1,1)-Std(1,1))) & (Array(2,:) < (Mean(2,1)-Std(2,1)))); L2 = ismember(L, col); L2 = I.*L2; figure('Name', 'Objects below mean-std :Centroid'), imshow(L2); [row, col] = find( (Array(1,:) > (Mean(1,1)+Std(1,1))) & (Array(2,:) > (Mean(2,1)+Std(2,1)))); L2 = ismember(L, col); L2 = I.*L2; figure('Name', 'Objects above mean+std :Centroid'), imshow(L2); [row, col] = find( (Array(1,:) > (Mean(1,1)-Std(1,1))) & (Array(2,:) > (Mean(2,1)-Std(2,1))) & ... (Array(1,:) < (Mean(1,1)+Std(1,1))) & (Array(2,:) < (Mean(2,1)+Std(2,1)))); L2 = ismember(L, col); L2 = I.*L2; figure('Name', 'Objects between mean-std and mean+std :Centroid'), imshow(L2); Experiment - centroid
Array = [FeatureData.Orientation]; Min = min(Array); Max = max(Array); Mean = mean(Array); Std = std(Array); figure('Name', 'histogram for Orientation'), hist(Array, 20); idx = find((Array < 0) & (Array > -90)); L2 = ismember(L, idx); L2 = I.*L2; figure('Name', 'Objects between -90 to 0 degree'), imshow(L2); idx = find((Array > 0) & (Array < 90)); L2 = ismember(L, idx); L2 = I.*L2; figure('Name', 'Objects between 0 and 90 degree'), imshow(L2); idx = find((Array < 180) & (Array > 90)); L2 = ismember(L, idx); L2 = I.*L2; figure('Name', 'Objects between 90 and 180 degree'), imshow(L2); Experiment – Axis of least second moment
Experiment – axis of least second moment(cont.) Note: The orientation of imfeature is different with the text book, and the value is in degree.