Download
1 / 17
170 likes | 361 Vues
U.S. GODAE: Global Ocean Prediction with the Hybrid Coordinate Ocean Model (HYCOM). Community Effort: NRL, U. of Miami, Los Alamos, NOAA/NCEP, NOAA/AOML, NOAA/PMEL, PSI, FNMOC, NAVOCEANO, SHOM, LEGI, OPeNDAP, UNC, Rutgers, USF, Fugro-GEOS, Orbimage, Shell, ExxonMobil.

E N D
U.S. GODAE: Global Ocean Prediction with the Hybrid Coordinate Ocean Model (HYCOM) Community Effort:NRL, U. of Miami, Los Alamos, NOAA/NCEP, NOAA/AOML, NOAA/PMEL, PSI, FNMOC, NAVOCEANO, SHOM, LEGI, OPeNDAP, UNC, Rutgers, USF, Fugro-GEOS, Orbimage, Shell, ExxonMobil Presented by Harley Hurlburt, NRL Stennis, USA International GODAE Steering Team Meeting X Met Office UK Exeter, UK 14-16 Nov 2005
Present U.S. Navy Operational Capabilities Related to GODAE Viewable on the web http://www.ocean.nrlssc.navy.mil/global_nlom http://www.fnmoc.navy.mil/PUBLIC http://www.navo.navy.mil 1 T239 or ~1/2 for atmospheric model boundary condition (on GODAE server) 2 Provide subsurface temperature • Real-time altimetry via NAVO Altimeter Data Fusion Center (ADFC) • NLOM: NRL Layered Ocean Model • GODAE: Global Ocean Data Assimilation Experiment • FNMOC operates a GODAE data server with data and products from a variety of sources, including real-time altimetry from the NAVO ADFC
U.S. Navy Future Operational Transitions Related to GODAE Participants: FNMOC, NAVO, NRL, ONR, Univ, Contractors 1 High vertical resolution for mixed layer prediction. Assimilates SSH from NLOM. Running in real-time, see http://www.ocean.nrlssc.navy.mil/global_ncom 2 Running in real-time, see http://www.ocean.nrlssc.navy.mil/global_nlom 3For coupled ocean-atmosphere prediction. 4 To give NAVO/Navy experience with HYCOM without official operational status; to be replaced by global HYCOM including the 1/25 Black Sea HYCOM 5Under the National Ocean Partnership Program (NOPP), 1/12 Atlantic HYCOM demo is already running in near real-time. Includes the Mediterranean Sea. Results at http://hycom.rsmas.miami.edu/ocean_prediction.html (80Tb LAS server soon)
User Interest in Real-time Global Ocean Products NRL Oceanography Division Web Site Hit Statistics during 2004 Top 25 Countries and # Hits Includes the following real-time global Ocean products and other results Altimeter data MODAS SSH & SST analyses Ocean prediction systems 1/16 global NLOM 1/8 global NCOM 1/12 Atlantic HYCOM
.08° Global HYCOM snapshot: SSH and ice (gray) May 2 model year 8 Climatological ERA15 forcing - HYCOM σ2* with 32 layers and GISS mixed layer
.08° Global HYCOM Mean Gulf Stream And Kuroshio Pathways Mean over four model years ERA15 climatological wind & thermal forcing
Global SSH Variability Oct 92 – Nov 98 SSH variability based on T/P, ERS-1 and ERS-2 altimeters (from Collecte, Localisation, Satellites (CLS)) SSH variability from .08° global HYCOM σ2* with climatological wind and thermal forcing
122°E 123°E 124°E 119°E 120°E 121°E 100 200 300 100 200 m/s 300 Sb-ADCP data from Liang et al. (2003, DSR Pt. II) Mean from HYCOM with ERA15 wind and thermal forcing No ocean data assimilation in HYCOM Velocity Cross-section Along Luzon Strait Sb-ADCP data (top) vs. .08° global HYCOM (bottom) in the upper 300 m Section along 21°N between 118.5°E and 124.0°E Cross-section overlaid on mean currents and speed
Nowcast Velocity field at 50 m depth superposed on the Temperature field from May 11 – June 13
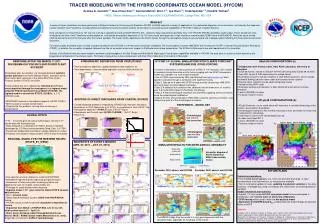
NOAA/NCEP Atlantic Ocean Forecast System Tide Gauge Comparisons for Hurricane Katrina Pensacola, FL Dauphin Island, AL 29 Aug 05 00:00 30 Aug 05 00:00 31 Aug 05 00:00 29 Aug 05 00:00 30 Aug 05 00:00 31 Aug 05 00:00 28 Aug 05 00:00 28 Aug 05 00:00 Days Days Waveland, MS Ocean Springs, MS Pilot’s Station, LA 29 Aug 05 00:00 30 Aug 05 00:00 31 Aug 05 00:00 28 Aug 05 00:00 29 Aug 05 00:00 30 Aug 05 00:00 28 Aug 05 00:00 29 Aug 05 00:00 30 Aug 05 00:00 28 Aug 05 00:00 Days Days Days
Consistency NAT Hycom and WFS ROMS WFS ROMS SST and surface velocity is shown inside the dashed line and outside of this area is the NAT HYCOM model. Warm water is detached from the Loop Current and transported northward as mesoscale eddies and filaments. From A. Barth, A. Alvera-Azcárate, R. He, R. H. Weisberg University of South Florida
Comparison with in situ velocity • Velocity at station C15 (10m isobath). • Due to a better representation of the coast geometry, the WFS ROMS model provides better results than the NAT HYCOM. The OI Winds also improve the model accuracy. From A. Barth, A. Alvera-Azcárate, R. He, R. H. Weisberg University of South Florida
SAB Nested Finite Element Model UNC-SAB modeling system sequence that nests the regional-scale QUODDY implementation (middle) within the 1/12 deg operational HYCOM-GODAE model (left). The limited-area QUODDY implementation (right) includes the estuary and tidal inlets along the Georgia/South Carolina coast and extends to the shelf-break. From Brian Blanton, University of North Carolina-Chapel Hill