Download
1 / 31
310 likes | 319 Vues
References. Shallow water equations Pedlosky : Geophysical Fluid Dynamics, Chapter 3, p57-93 Barotropical theory of the wind-driven circulation Pedlosky : Geophysical Fluid Dynamics, Chapter 5, p254-315. Thermohaline circulation Water mass in deep ocean

E N D
References • Shallow water equations Pedlosky: Geophysical Fluid Dynamics, Chapter 3, p57-93 • Barotropical theory of the wind-driven circulation Pedlosky: Geophysical Fluid Dynamics, Chapter 5, p254-315
Thermohaline circulation Water mass in deep ocean Deep water formation and property Antarctic Bottom Water North Atlantic Deep Water Abyssal circulation: Stommel-Arons model Meridional overturning circulation Reading materials: Pickard and Emery: Chapter 7 Pond and Pickard: Chapter 10 Talley, Pickard, Emery and Swift: Chapter 14 Evolution of Physical Oceanography (p6-69) Warren: Deep circulation of the world ocean (p6-41). Worthington: Water mass of the world ocean(p42-69). Pedlosky: Ocean Circulation Theory (p379-405)
Upper and Deep Ocean 1). The base of thermocline at a depth of roughly 1 km represents the lower boundary of the domain of the vigorous ocean circulation driven by the wind stress and large-scale distribution of heating and cooling (~upper ocean) 2). Below this region lies a vast volume of water (from 1~2 to 4~5 km, ~deep or abyssal ocean) 3). The deep ocean is cold everywhere T < 4oC almost everywhere below 2km T typically falls within 0-2oC at 4km In contrast to widespread area of SST of the order of 20oC
No major heat source or sink within deep ocean (most water properties are set at sea surface) Waters of such low temperatures can only be originated with surface waters at both polar regions (estimated filling rate:10-20 Sv) The presence at lower latitudes of such waters implies water movement in deep ocean (water properties are helpful for identifying flow path). Why is the deep ocean filled with cold water?
Water masses and water types • Water mass can be defined as a body of water with a common formation history (through an identifiable process) • Water mass can be identified by plotting temperature against salinity in a T-S diagram • Points in the property space (e.g., T-S diagram) are called water types • A source water type is the water type at the source of the water mass (define the water mass)
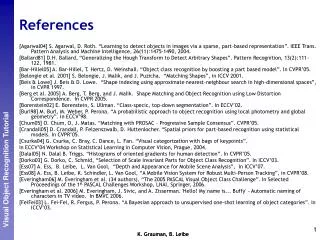
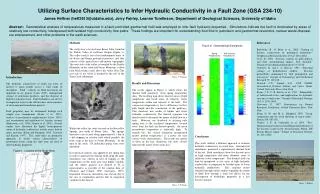
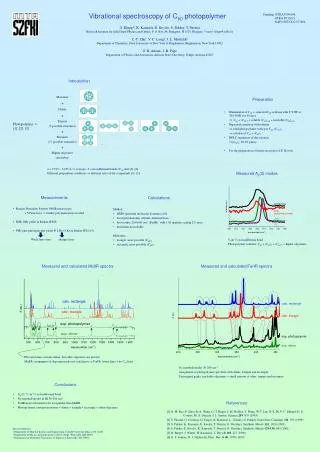
Examples of temperature-salinity (TS)-diagrams. The diagrams on the left show the distribution of temperature (red) and salinity (cyan) with depth; the diagrams on the right show the corresponding TS-diagrams. Top: layering of a warm and saline water mass found at 0 - 300 m depth above a cold and fresh water mass found at 300 - 600 m. The full lines show the situation before mixing, the broken lines after mixing. The TS-diagram shows the two water masses as TS points. Before mixing only the two points are seen in the TS-diagram. Mixing connects the two TS-points by a straight line. Bottom: layering of three water masses (intrusion of a low salinity water mass at 300 - 600 m depth). Again, the full lines show the situation before mixing, the broken lines after mixing. The TS- diagram shows two mixing lines; the erosion of the intermediate salinity minimum by mixing is seen by the departure of the broken curve from the original water mass point.
Each water mass is introduced in terms of • Its identifying characteristics • The ocean process that creates the specific characteristics Once identified, additional information is used to refine the water mass definition e.g., density range Example: Mediterranean Water (MW) • Salinity maximum layer in North Atlantic mid-depth (1000-2000m) • Saline outflow through Strait of Gibralter • Density range is a function of the source water and mixing with ambient North Atlantic water Subtropical Mode water (STMW) • Thickness (vertical homogeneity) • Originates in a thick surface winter mixed layer advected down along isopycnals into the ocean interior
Taking into account of the whole set of ocean properties and information about water mass, it is useful to think of the vertical structure in terms of four layers: upper, intermediate, deep, and bottom • Upper: surface mixed layer, thermocline, halocline, pycnocline etc. (in contact with the atmosphere (directly or through broad flow, e.g., through subduction process). • The other layers are all below pycnocline, identified by water masses that indicate surface origins, with respect to location and formation processes.
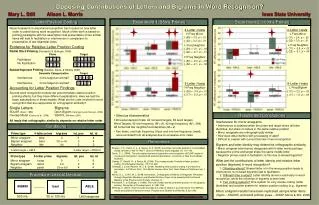
Deep Water Masses have distinct characters Volumetric T-S Diagram
How to track the water massesfrom temperature-salinity diagram Below the surface layer in permanent contact with the atmosphere, temperature and salinity are quasi-conservative properties, i.e., they can only be changed by mixing and advection. All other properties of sea water such as oxygen, nutrients etc. are affected by biological and chemical processes and therefore non- conservative. Water masses can therefore be identified by their temperature-salinity (T-S) combinations.
One of the oldest methods of classification is the temperature-salinity diagram (or T-S diagram). In any given area, a plot of temperature versus salinity data, from near the surface to the bottom, has distinctive and reproducible characteristics (excluding the top 100m, where seasonal temperature changes dominate). All data from a given region of the ocean can be expected to fall within a certain envelope, with greater variation near surface than at depth. Inspection of the shape of the curve allows one to distinguish between water masses.
Thermohaline Circulation Water renewal in deep ocean is mainly achieved by currents which are driven by density differences produced by temperature (thermal) and salinity (haline) effects. The associated circulation is therefore referred to as the thermohaline circulation. Since these movements are probably weak, it is often impractical to use current meters to measure them directly; they are usually deduced from the distribution of water properties and the application of geostrophy.
Heating at low latitudes Surface heating at the equator and cooling at higher latitudes generate meridional density difference that drives a overturning cell The overturning circulation is weak because the heat is in the shallow mixed layer The salinity effect (e.g., evaporation at subtropics and precipitation near the equator) enhances the tropical-subtropical thermal cell but counters the cooling in the higher latitudes with freshening The upper thermohaline cell is of secondary importance
Cooling at high latitudes • Net heat loss from the oceans at high latitudes • Cooling of the surface water and increase in density • Sink and replace deeper water • Density can also be increased when ice freezes out, ejecting salt and thus increasing the weight of the remaining water • Thermohaline circulation of the ocean is associated sinking to mid-depth or even to the ocean bottom.
Water mass formation by deep convection Deep convection occurs in regions of weak density stratification (mostly in polar and subpolar regions). When the water in the mixed layer gets denser than the water below, it sinks to great depth, in some regions reaching to the ocean floor. The density increase can be achieved by cooling or an increase in salinity (either through evaporation or through brine concentration during freezing) or both.
Sea Ice Covers 6-8% of ocean High reflectivity (Albedo 30-40%) (A barrier to solar radiation) Always colder than underline water (heat flux from ocean to the ice)
Halocline • A layer of rapidly changing salinity at about 50-200 meters in high latitudes of ice covered regions • The cooling temperature mostly freezes fresh water into ice crystals, leaving salt trapped in brine pocket • The unfrozen water sink and mix with sea water below
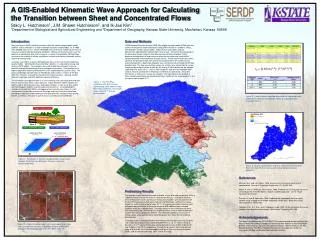
Track of Antarctic Bottom Water and North Atlantic Deep Water
Near Boundery Sinking 1). Dense water forms over the continental shelf, due to surface cooling and salt rejection during ice formation. The resulting convection yields cold, salty water at the depth on the shelf 2). Horizontal density gradient parallel to the coast produces local circulations for the reservoir to empty 3). Mixing with an off-shore water mass increases the density (cabbeling) 4). Dense, salty water on the shelf descends the slope under a balance of Coriolis, gravity, and frictional forces. The thermobaric effect may also contribute to the sinking
Sources of Antarctic Bottom WaterSinking around Antarctica The bottom water originates in several areas of the Antarctic continental shelf, where water is made sufficiently cold and saline that, in flowing down the continental slope and mixing with the surrounding deep water, it is dense enough to reach the floor of the ocean. In order of decreasing amount and extent of influence on the deep water property distributions—and presumably, therefore, of rate of bottom water production—these regions are the Weddell Sea, the Ross Sea, and the Adélie Coast; perhaps there is some production off Enderby Land, too.
Weddell Sea The deep water is formed at the continental shelf, which then flow into the Weddell Sea (-2oC, S=34.4~34.8, t=27.96) The shelf water mixes rapidly into the water above to form the Weddell Sea Bottom Water (= –0.7o ~ –0.8oC, t=27.9). It is estimated that the net flow out of the Weddell Sea is about 16 x 106 m3/s. The Weddell Sea Bottom Water is very cold but fresher than the overlaying water (S~34.52).
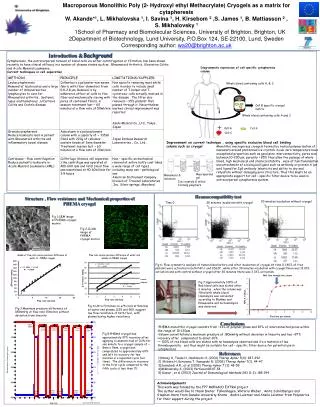
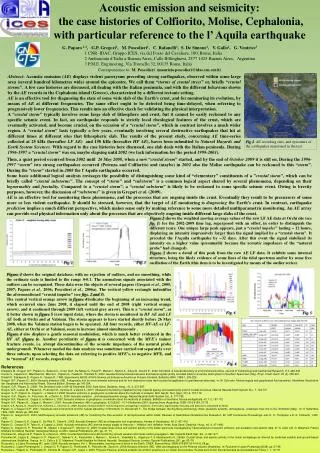
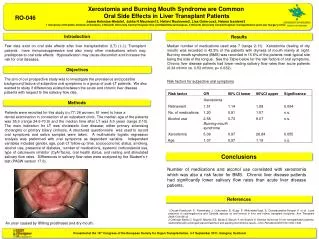
Observations made in 1968 on a station line running eastward from Antarctic Peninsula into Weddell Sea.
Observations made in 1968 on a station line running eastward from Antarctic Peninsula show a 200-m thick layer of relatively cold, fresh, low-silica bottom water on the slope, extending onto the floor of the Weddell Sea. The evidence points to a flow of shelf water down the slope, entraining and being diluted by the surrounding water on its way. (The continental shelf is unreachable throughout a year because of ice cover). Potential temperature Salinity Dissolved silica concentration Similar sections near 40oW, 29oW, 10oW-20oW show that the down slope flow gradually diminishes to the eastward.
The distribution of bottom potential temperature in the Weddell Sea demonstrates that the newly formed bottom water leaves the continental slope mainly at the northern tip of the Antarctic Peninsula, near 63o-65oS. At the edge of the continental shelf, the water has = –1.2 to –1.4oC the rate of sinking is 2-5x10⁶ m3/s.
Other Sources of the Bottom Water Ross Sea More saline and denser water (S>34.72, t=28.1 ) are found near the bottom of ocean in the southwestern Pacific, north of the Ross Sea near the mid-ocean ridge (about 65oS), and close to Antarctica south of Australia. This high salinity bottom water can be traced back to the deep depressions on the shelf of Ross Sea. The cold saline shelf water has been observed to descend the western continental slope in a manner similar to that of the down slope flow in the Weddell Sea. The off shelf flux is roughly 0.6 x 10⁶ m3/s Adélie Coast Deep depressions of much smaller area on the continental shelf of the Adélie Coast of Antarctica. They are filled below their sill depths with water temperature close to the freezing point, and of salinity 34.4—34.7, probably as a result of deep convection associated with winter sea-ice formation. Such water spilling over the sills forms a layer a few tens of meters thick on the near-by continental slope, underlying the high salinity bottom water from the Ross Sea. The flow down the continental slope appears intermittent. This low-salinity bottom water mixes into the Ross Sea water rapidly enough that it has not been detected far from the continental rise near its point of origin. Enderby Land Small amount of bottom water production.
Antarctic Bottom Water • Bottom water from these several sources mixes with the warmer, more saline water above (the Antarctic Circumpolar Water) to form the “Antarctic Bottom Water” of the world ocean. (t =27.96, T=0.3oC, S=34.7-34.8 at sub-Antarctic zone 40-50oS). • The Antarctic Bottom Water is the coldest, and the densest, deep water in the open ocean, detectable into northern latitudes by low temperatures close to the bottom. • The Antarctic Bottom Water flows into the South Atlantic and eastward through the Indian and Pacific sectors of the Southern Ocean. Below 4000m depth, all Atlantic Ocean basins are mainly occupied by the Antarctic Bottom Water.
Passages of AABW The path of Antarctic Bottom Water is strongly affected by the topography. The water mass spreads northward from both east and west of the Mid-Atlantic Ridge. On the western side, it is detectable well into the northern hemisphere past 50oN. On the eastern side, the water flows along the Walvis Ridge (20oS-30oS). Since the basin is closed in the north below the 3000m level at the Walvis Ridge, its northward progress comes to a halt there. The flow follows the depth contours in cyclonic motion, and the bottom water leaves the basin on the eastern side toward s the Indian Ocean. Antarctic Bottom Water enters the eastern basins north of the Walvis Ridge near the equator by passing the Romanche Fracture Zone. As a result, potential temperature increases slowly both northward and southward from the equator in the eastern basins.