Download
1 / 5
80 likes | 415 Vues
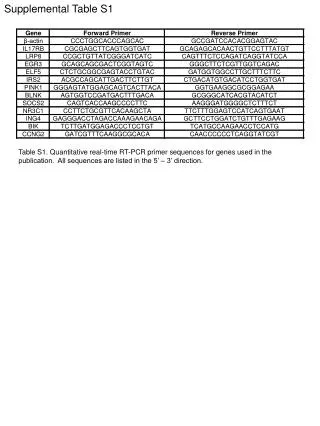
Supplemental Table 1 Keap1 mutation in NSCLC cell lines. Supplemental Figure 1. 220185.708. 134636.552. Microarray signal value. Supplemental Figure 2. A. AKR1C1. Hoechst. Merge. H1703. B. H1838. AKR1C1. Relative fluorescent intensity. H2347. H1437. H2122. H2030.

E N D
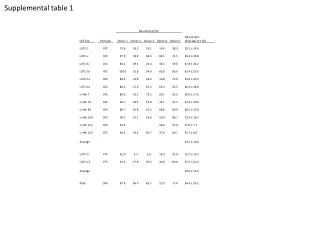
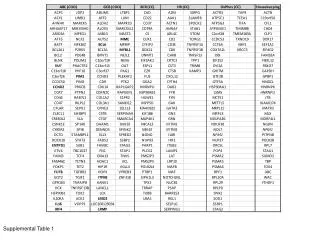
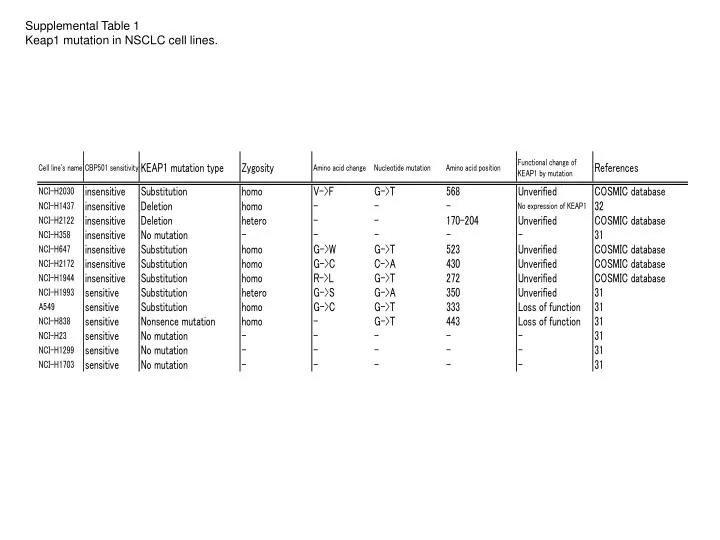
Supplemental Table 1 Keap1 mutation in NSCLC cell lines.
Supplemental Figure 1 220185.708 134636.552 Microarray signal value
Supplemental Figure 2 A AKR1C1 Hoechst Merge H1703 B H1838 AKR1C1 Relative fluorescent intensity H2347 H1437 H2122 H2030
Supplemental Figure 3 A AKR1B10 Hoechst Merge H1703 H1838 B AKR1B10 H2347 Relative fluorescent intensity H1437 H2122 H2030
Supplemental Figure legends Supplemental Figure 1 Comparative analysis of individual gene expression as in CBP501 insensitive cell lines or the CBP501 sensitive cell lines from figure 2. Black bars indicate the average values of expression in CBP501 insensitive cell lines. Red bars indicate the average values of expression in CBP501 sensitive cell lines. Supplemental Figure 2 (A) Immunocytochemistry for AKR1C1 in NSCLCs. Left panels show AKR1C1 in a pseudo-color of green. Middle panels show Hoechst in a pseudo-color of red. Right panels show the merged images. Scale bar indicates 100mm. (B) Quantification of AKR1C1 intensities from A (n=5). Supplemental Figure 3 (A) Immunocytochemistry for AKR1B10 in NSCLCs. Left panels show AKR1B10 in a pseudo-color of green. Middle panels show Hoechst dye in a pseudo-color of red. Right panels show the merged images. Scale bar indicates 100mm. (B) Quantification of AKR1B10 intensities from A (n=5).