Download
1 / 48
480 likes | 603 Vues
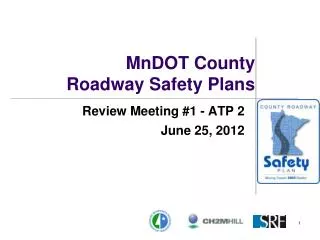
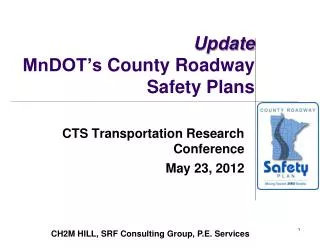
County Roadway Safety Plans Phase IV Kickoff Meeting. Metro April 30, 2012. CH2M HILL, SRF Consulting Group, P.E. Services. Agenda. Introductions & Opening Remarks Project Overview Goals, Objectives Team, Schedule, Process County Participation and Opportunities Data Needs

E N D
County Roadway Safety Plans Phase IV Kickoff Meeting Metro April 30, 2012 CH2M HILL, SRF Consulting Group, P.E. Services
Agenda • Introductions & Opening Remarks • Project Overview • Goals, Objectives • Team, Schedule, Process • County Participation and Opportunities • Data Needs • Safety Emphasis Areas • Safety Strategies • Safety Workshop • Safety Projects • Next Steps • Questions/Comments
Participating Counties • Metro • Anoka • Carver • Dakota • Ramsey • Scott • Washington Metro
County Road Safety Plans • Sponsored by… • Funding provided by the Minnesota Department of Transportation • Almost $3.5 million made available to prepare County Safety Plans for 87 counties over three years
Goals and Objectives • Development of County Safety Plans • Establish safety emphasis areas • High priority safety strategies • At-risk locations • Safety investment options • Identify high priority safety projects, both proactive and reactive. • Position counties to compete for safety funds • Highway Safety Improvement Program • High Risk Rural Roads Program • Minnesota Central Safety Funds • Foster safety culture among county stakeholders
Project Approach – Phase IV June 2012 April 2012 April 2012 July 2012 Develop Comprehensive List of Safety Strategies Crash Analysis Select Safety Emphasis Areas Safety Workshop June 2012 Kick-off Video Meeting Review Mtg w/ Counties Project Programming Project Development Implementation Evaluation Refinement & Update SHSP Oct 2012 Identify Short List of Critical Strategies Identify Safety Projects Nov 2012 Sept 2012 January 2013 Safety Plan
Data Needs • We suggest a division of your system into intersections and segments, you review and concur/edit. • Intersections • Traffic control devices • Street lights • Distance to previous STOP sign • Segments • Logical termini • Facility type (2-lane, 4-lane, etc) • Paved or gravel • Ann Johnson has sent each of you a preliminary list of your Intersections, Segments and Curves. Please review these lists and get revisions back to Ann by May 15th. • Curves • Installed chevrons • County Logo
Metro County Severe Crash Numbers Anoka Legend 10/yr (50 total) - Severe crashes on any jurisdiction 4/yr (20 total) - Severe crashes on CSAH/CR MnCMAT Crash Data, 2006-2010 Severe = K (fatal) + A (life-changing injury) 96/yr (483) 44/yr (222) Washington 41/yr (206) 13/yr (67) Ramsey 113/yr (568) 45/yr (229) Carver 20/yr (104) 9/yr (47) Scott Dakota 34/yr (171) 22/yr (112) 79/yr (398) 38/yr (191)
Metro County Crash Data Overview Source: MnCMAT Crash Data, 2006-2010 Severe is fatal and serious injury crashes (K+A). 5 Year Crashes Metro 214,139 3,157 Example All – % Severe – % CSAH/CR 68,322 – 32% 1,339 – 42% State System 83,784 – 39% 924 – 29% City, Twnshp, Other 62,033 – 29% 894 – 28% Urban 65,433 – 96% 1,171 – 87% Rural 2,848 – 4% 164 – 12% Int 767 – 71% 93 – 64% Signal 536 – 70% 51 – 55% Ped 1,076 – 43% 145 – 64% Bike 1,410 – 57% 80 – 36% Int 1,101 – 78% 52 – 65% Signal 683 – 62% 32 – 62% Not Animal 2,364 – 83% 158 – 96% Animal 483 – 17% 6 – 4% Non Ped/Bike 62,923 – 96% 946 – 81% Ped/Bike 2,486 – 4% 225 – 19% Unknown/Other 264 – 11% 5 – 3% Inters-Related 924 –39% 61 – 39% Not Inters-Related 1,176 – 50% 92 – 58% Unknown/Other 9,314 – 15% 87 – 9% Not Inters-Related 15,560 – 25% 290 – 31% Inters-Related 38,045 – 60% 569 – 60% Other/Unknown 256 – 28% 24 – 39% Signalized 82 – 9% 1 – 2% All Way Stop 47 – 5% 2 – 3% Thru-Stop 539 – 58% 34 – 56% Run Off Road – 2,264 (15%), 77 (27%) Rear End – 5,575 (36%), 62 (21%) Head On – 1,097 (7%), 61 (21%) “Other”– 1,262 (8%), 29 (10%) Right Angle – 1,619 (10%), 24 (8%) Right Angle – 199 (37%), 15 (44%) Run Off Road – 50 (9%), 4 (12%) Head On – 37 (7%), 4 (12%) Signalized 23,077 – 61% 277 – 49% All Way Stop 1,376 – 4% 23 – 4% Thru-Stop 7,344 – 19% 156 – 27% Other/Unknown 6,241 – 16% 113 – 20% Head On, SS Opp 93 – 8% 16 – 17% Run off Road 719 – 61% 56 – 61% Run Off Road – 81 (32%), 6 (25%) Head On/SS Opp – 19 (7%), 4 (17%) Right Angle – 20 (8%), 3 (13%) Right Angle – 6,372 (28%), 141 (51%) Rear End – 8,514 (37%), 51 (18%) Left Turn – 3,374 (15%), 29 (10%) Head On – 807 (4%), 17 (6%) Right Angle – 3,121 (42%), 80 (51%) Rear End – 1,803 (25%), 15 (10%) Left Turn – 757 (10%), 15 (10%) Head On – 208 (3%), 11 (7%) On Curve 34 – 37% 4 – 25% On Curve 345 – 48% 33 – 59%
Greater Minnesota Crash Data Overview Source: MnCMAT Crash Data, 2006-2010 Severe is fatal and serious injury crashes (K+A). 5 Year Crashes 156,182 4,902 -ATP’s 1, 2, 3, 4, 6, 7, and 8 – NO Metro Example All – % Severe – % CSAH/CR 36,716 – 24% 1,963 – 40% State System 70,808 – 45% 2,000 – 41% City, Twnshp, Other 48,658 – 31% 939 – 19% Urban 14,086 – 38% 337 – 17% Rural 22,630 – 62% 1,626 – 83% Not Animal 18,616 – 82% 1,566 – 96% Animal 4,009 – 18% 60 – 4% Unknown/Other 1,577 – 11% 17 – 5% Not Inters-Related 5,177 – 37% 175 – 52% Inters-Related 7,332 – 52% 145 – 43% Unknown/Other 1,276 – 7% 61 – 4% Inters-Related 5,487 – 29% 463 – 30% Not Inters-Related 11,849 – 64% 1,042 –66% Run Off Road – 1,202 (23%), 69 (39%) Head On – 366 (7%), 27 (15%) “Other” – 540 (10%), 25 (14%) Rear End – 1,336 (26%), 17 (10%) Other/Unknown 2,600 – 47% 228 – 49% Signalized 209 – 4% 4 – 1% All Way Stop 164 – 3% 15 – 3% Thru-Stop 2,511 – 46% 216 – 47% Head On, SS Opp. 751 – 6% 132 – 13% Run off Road 7,891 – 67% 675 – 65% Signalized 2,308 – 31% 32 – 22% All Way Stop 445 – 6% 5 – 3% Thru-Stop 2,697 – 37% 65 – 45% Other/Unknown 1,881 – 26% 43 – 30% Run Off Road – 999 (38%), 95 (42%) Right Angle – 268 (10%), 39 (17%) “Other” – 303 (12%), 29 (13%) Head On – 112 (4%), 21 (9%) On Curve 247 – 33% 46 – 35% On Curve 3,222 – 40% 339 – 50% Right Angle – 633 (27%), 15 (47%) Rear End – 799 (35%), 5 (16%) Left Turn – 375 (16%), 5 (16%) Head On – 100 (4%), 4 (13%) Right Angle – 1,268 (47%), 37 (86%) “Other” – 252 (9%), 9 (21%) Left Turn – 268 (10%), 4 (9%) Rear End – 333 (12%), 3 (7%) Right Angle – 849 (34%), 122 (56%) “Other” – 464 (18%), 33 (15%) Run Off Road – 342 (14%), 21 (10%) Left Turn – 184 (7%), 10 (5%)
Anoka County Crash Data Overview 5 Year Crashes Anoka 17,847 483 Example All – % Severe – % Source: MnCMAT Crash Data, 2006-2010 -- Severe is fatal and serious injury crashes (K+A). CSAH/CR 7,270 – 41% 222 – 46% State System 7,027 – 39% 178 – 37% City, Twnshp, Other 3,550 – 20% 83 – 17% Urban 7,086 – 97% 201 – 91% Rural 144 – 2% 17 – 8% Int 28 – 55% 8 – 67% Signal 16 – 57% 4 – 50% Ped 51 – 29% 12 – 50% Bike 122 – 71% 12 – 50% Int 106 – 87% 10 – 83% Signal 70 – 66% 7 – 70% Not Animal 129 – 90% 17 – 100% Animal 15 – 10% 0 – 0% Non Ped/Bike 6,912 – 98% 177 – 88% Ped/Bike 173 – 2% 24 – 12% Unknown/Other 10 – 8% 0 – 0% Inters-Related 41 – 32% 4 – 24% Not Inters-Related 78 – 60% 13 – 76% Unknown/Other 417 – 6% 7 – 4% Not Inters-Related 2,205 – 32% 59 – 33% Inters-Related 4,290 – 62% 111 – 63% Other/Unknown 14 – 34% 2 – 50% Signalized 0 – 0% 0 – 0% All Way Stop 9 – 22% 1 – 25% Thru-Stop 18 – 44% 1 – 25% Run Off Road – 432 (20%), 16 (27%) • Head On – 198 (9%), 12 (20%) Rear End – 760 (34%), 9 (15%) Right Angle – 256 (12%), 7 (12%) Signalized 2,189 – 51% 43 – 39% All Way Stop 221 – 5% 9 – 8% Thru-Stop 978 – 23% 27 – 24% Other/Unknown 902 – 21% 32 – 29% Head On, SS Opp 6 – 8% 1 – 8% Run off Road 37 – 47% 5 – 38% Right Angle – 573 (26%), 24 (56%) Rear End – 990 (45%), 11 (26%) Left Turn – 264 (12%), 3 (7%) Run Off Road – 43 (2%), 2 (5%) Right Angle – 465 (%), 11 (%) • Head On/SS Opp – 45 (%), 6 (%) Rear End – 221 (%), 3 (%) Left Turn – 103 (%), 2 (%) • Rear End – 392 (%), 7 (%) Right Angle – 127 (%), 7 (%) • Head On/SS Opp – 60 (%), 7 (%) Left Turn – 75 (%), 4 (%) On Curve 2 – 33% 0 – 0% On Curve 26 – 70% 4 – 80%
Carver County Crash Data Overview 5 Year Crashes Carver 5,090 104 Example All – % Severe – % Source: MnCMAT Crash Data, 2006-2010 -- Severe is fatal and serious injury crashes (K+A). CSAH/CR 1,544 – 30% 47 – 45% State System 2,630 – 52% 45 – 43% City, Twnshp, Other 916 – 18% 12 – 12% Urban 827 – 54% 15 – 32% Rural 717 – 46% 32 – 68% Not Animal 590 – 82% 30 – 94% Animal 126 – 18% 2 – 6% Non Ped/Bike 815 – 99% 13 – 87% Ped/Bike 12 – 1% 2 – 13% Unknown/Other 48 – 8% 1 – 3% Inters-Related 180 – 31% 6 – 20% Not Inters-Related 362 – 61% 23 – 77% Unknown/Other 96 – 12% 1 – 8% Not Inters-Related 241 – 30% 4 – 31% Inters-Related 478 – 59% 8 – 62% Other/Unknown 64 – 36% 4 – 67% Signalized 11 – 6% 0 – 0% All Way Stop 3 – 2% 0 – 0% Thru-Stop 102 – 57% 2 – 33% Run Off Road – 86 (36%), 3 (75%) • Head On – 20 (8%), 1 (25%) Rear End – 62 (26%), 0 (0%) Right Angle – 29 (28%), 2 (100%) Signalized 166 – 35% 0 – 0% All Way Stop 22 – 5% 0 – 0% Thru-Stop 182 – 38% 7 – 88% Other/Unknown 108 – 23% 1 – 12% Head On, SS Opp 25 – 7% 2 – 9% Run off Road 245 – 68% 18 – 78% Run Off Road – 27 (42%), 2 (50%) Right Angle – 5 (8%), 2 (50%) Right Angle – 32 (19%), 0 (0%) Rear End – 74 (45%), 0 (0%) Right Angle – 55 (30%), 3 (43%) • Left Turn – 15 (8%), 2 (29%) Rear End – 70 (38%), 1 (14%) On Curve 12 – 48% 1 – 50% On Curve 137 – 56% 13 – 72%
Dakota County Crash Data Overview 5 Year Crashes Dakota 22,607 398 Example All – % Severe – % Source: MnCMAT Crash Data, 2006-2010 -- Severe is fatal and serious injury crashes (K+A). CSAH/CR 7,810 – 35% 191 – 48% State System 8,687 – 38% 115 – 29% City, Twnshp, Other 6,110 – 27% 92 – 23% Urban 7,029 – 90% 154– 81% Rural 781 – 10% 37 – 19% Int 28 – 70% 8 – 80% Signal 19 – 68% 4 – 50% Ped 40 – 23% 10 – 50% Bike 135 – 77% 10 – 50% Int 117 – 87% 5 – 50% Signal 70 – 60% 3 – 60% Not Animal 601 – 77% 33 – 89% Animal 180 – 23% 4 – 11% Non Ped/Bike 6,852 – % 134 – % Ped/Bike 175 – 2% 20 – 13% Unknown/Other 55 – 9% 2 – 6% Inters-Related 196 –33% 9 – 27% Not Inters-Related 350 – 58% 22 – 67% Unknown/Other 575 – 8% 6 – 4% Not Inters-Related 1,537 – 22% 43 – 32% Inters-Related 4,740 – 69% 85 – 63% Other/Unknown 46 – 23% 3 – 33% Signalized 10 – 5% 0 – 0% All Way Stop 1 – 1% 0 – 0% Thru-Stop 139 – 71% 6 – 67% • Head On/SS Opp – 135 (9%), 14 (33%) Run Off Road – 250 (16%), 13 (30%) Rear End – 587 (38%), 10 (23%) Right Angle – 51 (37%), 3 (50%) Run Off Road – 12 (9%), 1 (17%) Signalized 2,737 – 58% 38 – 45% All Way Stop 265 – 6% 2 – 2% Thru-Stop 1,125 – 24% 35 – 41% Other/Unknown 613 – 13% 10 – 12% Head On, SS Opp 25 – 7% 7 – 32% Run off Road 137 – 39% 13 – 59% Right Angle – 6 (13%), 1 (33%) Head On – 4 (9%), 1 (33%) Left Turn – 1 (2%), 1 (33%) Right Angle – 569 (21%), 21 (55%) Rear End – 1,344 (49%), 7 (18%) Left Turn – 224 (8%), 6 (16%) Head On – 101 (4%), 3 (8%) Right Angle – 433 (38%), 14 (40%) “Other” – 85 (8%), 7 (20%) Left Turn – 124 (11%), 6 (17%) Head On/SS Opp – 56 (5%), 3 (9%) On Curve 6 – 24% 0 – 0% On Curve 87 – 64% 3 – 23%
Ramsey County Crash Data Overview 5 Year Crashes Ramsey 52,915 568 Example All – % Severe – % Source: MnCMAT Crash Data, 2006-2010 -- Severe is fatal and serious injury crashes (K+A). CSAH/CR 17,901 – 34% 229 – 40% State System 21,832 – 41% 178 – 31% City, Twnshp, Other 13,182 – 25% 161 – 28% Urban 17,791 – 99% 224– 98% Rural 110 – 1% 5 – 2% Int 236 – 70% 28 – 60% Signal 155 – 66% 14 – 50% Ped 338 – 51% 47 – 76% Bike 319 – 49% 15 – 24% Int 243 – 76% 11 – 73% Signal 143 – 59% 7 – 64% Not Animal 97 – 88% 5 – 100% Animal 13 – 12% 0 – 0% Non Ped/Bike 17,131 – 96% 162 – 72% Ped/Bike 657 – 4% 62 – 28% Unknown/Other 13 – 13% 0 – 0% Inters-Related 43 –44% 2 – 40% Not Inters-Related 41 – 42% 3 – 60% Unknown/Other 1,308 – 7% 10 – 6% Not Inters-Related 4,210 – 25% 47 – 29% Inters-Related 11,611 – 68% 105 – 65% Other/Unknown 10 – 23% 1 – 50% Signalized 2 – 5% 0 – 0% All Way Stop 9 – 21% 0 – 0% Thru-Stop 22 – 51% 1 – 50% • Rear End – 1,566 (37%), 16 (34%) Run Off Road – 403 (10%), 9 (19%) Head On – 216 (5%), 7 (15%) “Other” – 313 (7%), 6 (13%) • Right Angle – 501 (12%), 3 (6%) Run Off Road – 2 (9%), 1 (100%) Head On/SS Opp – 2 (20%), 1 (100%) Signalized 7,375 – 64% 61 – 58% All Way Stop 473 – 4% 6 – 6% Thru-Stop 1,948 – 17% 22 – 21% Other/Unknown 1,812 – 16% 16 – 15% Head On, SS Opp 6 – 15% 1 – 33% Run off Road 12 – 29% 0 – 0% Right Angle – 2,083 (28%), 27 (44%) Rear End – 2,325 (32%), 11 (18%) Left Turn – 1,523 (21%), 10 (16%) “Other” – 314 (4%), 5 (8%) Right Angle – 836 (43%), 12 (55%) Rear End – 496 (25%), 3 (14%) Head On/SS Opp – 74 (4%), 2 (9%) Run Off Road – 41 (2%), 2 (9%) On Curve 3 – 50% 1 – 100% On Curve 7 – 58% 0 – 0%
Scott County Crash Data Overview 5 Year Crashes Scott 5,908 171 Example All – % Severe – % Source: MnCMAT Crash Data, 2006-2010 -- Severe is fatal and serious injury crashes (K+A). CSAH/CR 2,308 – 39% 112 – 65% State System 2,370 – 40% 32 – 19% City, Twnshp, Other 1,230 – 21% 27 – 16% Urban 1,842 – 80% 63 – 56% Rural 466 – 20% 49 – 44% Int 7 – 78% 2 – 67% All Way Stop 2 – 29% 2 – 100% Ped 9 – 23% 3 – 50% Bike 30 – 77% 3 – 50% Int 29 – 97% 3 – 100% Signal 14 – 48% 2 – 67% Not Animal 439 – 94% 49 – 100% Animal 27 – 6% 0 – 0% Non Ped/Bike 1,802 – 98% 57 – 90% Ped/Bike 39 – 2% 6 – 10% Unknown/Other 89 – 20% 2 – 4% Inters-Related 194 – 44% 26 – 53% Not Inters-Related 156 – 36% 21 – 43% Unknown/Other 111 – 6% 2 – 4% Not Inters-Related 544 – 30% 19 – 33% Inters-Related 1,147 – 64% 36 – 63% Other/Unknown 52 – 27% 7 – 27% Signalized 15 – 8% 0 – 0% All Way Stop 8 – 4% 1 – 4% Thru-Stop 119 – 61% 18 – 69% Run Off Road – 112 (21%), 8 (42%) • Right Angle – 53 (10%), 4 (21%) Rear End – 184 (34%), 3 (16%) Head On – 44 (8%), 3 (16%) Right Angle – 54 (45%), 7 (39%) Head On/SS Opp – 18 (15%), 5 (28%) Signalized 618 – 54% 8 – 22% All Way Stop 39 – 3% 1 – 3% Thru-Stop 293 – 26% 18 – 50% Run Off Road – 13 (25%), 2 (29%) Other/Unknown 197 – 17% 9 – 25% Head On, SS Opp 12 – 8% 2 – 10% Run off Road 98 – 63% 15 – 71% Head On – 13 (7%), 3 (33%) Run Off Road – 32 (16%), 2 (22%) Right Angle – 105 (17%), 6 (75%) Rear End – 328 (53%), 1 (12%) Head On – 25 (4%), 1 (12%) Right Angle – 134 (46%), 10 (56%) Left Turn – 36 (12%), 2 (11%) • Head On – 10 (3%), 2 (11%) • Rear End – 53 (18%), 1 (6%) On Curve 7 – 58% 1 – 50% On Curve 44 – 45% 8 – 43%
Washington County Crash Data Overview 5 Year Crashes Washington 12,847 206 Example All – % Severe – % Source: MnCMAT Crash Data, 2006-2010 -- Severe is fatal and serious injury crashes (K+A). CSAH/CR 3,428 – 27% 67 – 33% State System 5,803 – 45% 88 – 43% City, Twnshp, Other 3,616 – 28% 51 – 25% Urban 3,036 – 89% 52 – 78% Rural 392 – 11% 15 – 22% Not Animal 301 – 77% 15 – 100% Animal 91 – 23% 0 – 0% Non Ped/Bike 2,983 – 98% 48 – 92% Ped/Bike 53 – 2% 4 – 8% Unknown/Other 34 – 11% 0 – 0% Inters-Related 128 – 43% 8 – 53% Not Inters-Related 139 – 46% 7 – 47% Unknown/Other 305 – 10% 6 – 13% Not Inters-Related 780 – 26% 16 – 33% Inters-Related 1,898 – 64% 26 – 54% Other/Unknown 42 – 33% 6 – 75% Signalized 12 – 9% 0 – 0% All Way Stop 9 – 7% 0 – 0% Thru-Stop 65 – 51% 2 – 25% Run Off Road – 173 (22%), 5 (31%) • Head On – 73 (9%), 5 (31%) Rear End – 225 (29%), 3 (19%) Right Angle – 77 (10%), 2 (13%) Right Angle – 20 (31%), 1 (50%) Run Off Road – 4 (6%), 1 (50%) Signalized 969 – 51% 6 – 23% All Way Stop 136 – 7% 3 – 12% Thru-Stop 451 – 24% 8 – 31% Other/Unknown 341 – 18% 9 – 35% Head On, SS Opp 15 – 11% 3 – 43% Run off Road 70 – 50% 3 – 43% Run Off Road – 14 (33%), 2 (33%) • SS Pass – 5 (12%), 1 (17%) SS Opp – 1 (2%), 1 (17%) Rear End – 427 (44%), 3 (50%) Right Angle – 196 (20%), 1 (17%) Head On – 19 (2%), 1 (17%) Left Turn – 189 (20%), 0 (0%) Right Angle – 203 (60%), 4 (44%) Rear End – 86 (25%), 3 (33%) • Head On – 17 (5%), 1 (11%) Left Turn – 45 (13%), 0 (0%) On Curve 3 – 20% 1 – 33% On Curve 37 – 53% 3 – 100%
Safety Strategies Overview NCHRP Report 500 • A series of guides to assist state and local agencies in reducing injuries and fatalities in targeted emphasis areas • The guides correspond to the emphasis areas outlined in the AASHTO Strategic Highway Safety Plan. • Each guide includes a brief introduction, a general description of the problem, the strategies/ countermeasures to address the problem, and a model implementation process.
Example - Pedestrian Strategies Countdown Timers and Advanced Pedestrian Intervals Curb Extensions and Medians
Safety Workshop Objective: Multidisciplinary discussion of a short list of safety strategies (Note: there is no discussion of specific locations.) • Date/Time: To be determined • Location: To be determined • Agenda • 8:30 – Coffee and Registration • 9AM – Introductions • Presentations – Law Enforcement and/or Local Safety Advocates • Background Information/Desired Outcomes • Breakout Sessions – Prioritize Strategies • 12PM – 1PM - Lunch • Report Back/Final Presentation • 2:45 – 3PM - Wrap-up
Phase I, II & III - Workshops Completed 18 workshops with over 700 attendees PHASE I PHASE II March 4, 2011 Hennepin County Public Works 39 Attendees Hennepin County 255 PHASE III
Urban County- Workshops Voting Results
Suggested Grouping for Safety Workshops • Available Dates: See Workshop Handout • Group 5A • Anoka • Ramsey • Group 5B • Dakota • Washington • Group 5C • Carver • Scott
Safety Workshop – County Assignments • May • Confirm groups and select group leaders • Prioritize dates • June • Group Coordinator - Secure Location and Caterer • 50-100 people • $12/person (“all in” including delivery, tax and tip) • Send invites (example will be provided) • July • Group Coordinator - Confirm final headcount (10 days prior to workshop) • Group Coordinator - Email Carla Stueve (SRF) cstueve@srfconsulting.com • Confirm Audio-visual availability for the workshop
Project Development • Reactive Approach – Identifying Black Spot locations with crash rate above the critical crash rate and/or experienced multiple severe crashes in the 5-year study period. • The Systemic Approach – Applying high priority/low cost safety strategies at the at-risk locations across each county’s system of highways. The key questions: • Is every element of the county system equally at risk? • Where to Start? • A new approach to safety planning Old Approach Crashes = Risk & No Crashes = No Risk New Approach No Crashes ≠ No Risk Use surrogates of crashes (roadway and traffic characteristics) to identify risk and prioritize – the 5 (or 6) Ranking System
Support for the SYSTEMIC Approach 68 Greater Minnesota Counties • Segments: 786 severe road departure crashes on 21,000 miles of rural paved county roads • Average Density = 0.01 severe road departure crashes/year • No segments average one severe road departure crash per year • Curves: 327 severe crashes on 15,000 curves • Average Density = 0.004 severe crashes/curve/year • 85% of curves had NO crashes (during 5-year study period) • 5 curves with 2 fatal crashes (0.03% of curves), 19 curves with 2 severe crashes (0.1% of curves) • No curve averaged one severe crash per year • Intersections: 640 severe crashes over 10,000 rural thru/STOP intersections • Average Density = 0.01 severe crashes/intersection/year • No intersection averaged one severe crash per year Target Crash Types The most frequently occurring crashes which represent the greatest opportunity for reduction. The target crash types are RARE. No rural segment, curve or intersection qualifies as a High Crash Location – use the systemic approach to identify risk and prioritize candidate locations for safety investment. Source: MnCMAT 2006-2010 Severe Crashes = Fatal + A Injury
Support for the SYSTEMIC Approach 1 Metro County Signalized Intersections: 919 signalized intersections • RIGHT ANGLE: 95 severe right angle crashes • Average Density = 0.02 severe right angle crashes/intersection/year • 90% of intersections had NO severe right angle crashes, 2% had TWO, and 8% had ONE • No signalized intersection averaged one severe right angle crash per year • PED/BIKE: 54 severe ped/bike crashes • Average Density = 0.01 severe crashes/intersection/year • 94% of intersections had NO severe right angle crashes, 5% had ONE, 0.5% had TWO, 0.2% had THREE • No signalized intersection averaged one severe ped/bike crash per year Segments: 32 severe rear end crashes over 560 miles of county highway • Average Density = 0.01 severe rear end/mile/yea • 87% of corridors had NO severe right angle crashes, 10% had ONE, 2% had TWO, 1 corridor had THREE • No corridor averaged one severe rear end crash per year Target Crash Types The most frequently occurring crashes which represent the greatest opportunity for reduction. The target crash types are RARE. No intersection or segment qualifies as a High Crash Location – use the systemic approach to identify risk and prioritize candidate locations for safety investment. Source: MnCMAT 2006-2010 Severe Crashes = Fatal + A Injury
Urban Signalized Intersection Pedestrian Crash Risk Rating Criteria Characteristics (NOT causation!) • Traffic Signal • Speed Limit • Four Legged • Undivided Roadway • Bus Stop • Pedestrian Generator Percent of Severe Pedestrian Crashes
Rural Road Segment – Risk Rating Criteria (Part 1) Characteristics • Traffic Volume • Access Density • Edge Risk Assessment • Curve Density • Crash Density (786 crashes)
Edge Risk Assessment Rural Road Segment – Risk Rating Criteria (Part 2) 1 Usable Shoulder, Reasonable Clear Zone 2 -No Usable Shoulder but Reasonable Clear Zone 2– Usable Shoulder but Roadside with Fixed Obstacles 3 No Usable Shoulder, Roadside with Fixed Obstacles
Rural Horizontal Curve– Risk Rating Criteria Characteristics • Curve Radius • Traffic Volume • Intersection • Visual Trap • Severe Crash
Rural Thru STOP Intersection Risk Rating Criteria Characteristics • Geometry • Skewed minor leg approach • Intersection on/near horizontal curve • Volume • Minor ADT/Major ADT ratio • Proximity • Previous STOP sign • Railroad crossing • Intersection Related Crashes • Commercial Development in quadrants
Example Rural County Prioritization Segments Intersections Curves Is the County’s entire system at-risk?
Example Urban County Prioritization Intersections – Right-Angle Intersections - Pedestrians
Do the Rating Criteria Really Identify At-Risk Locations? Curve Risk Criteria Phase I and II Curves – 3,990 curves included in analysis of each risk factor. Minimum of 1,500 curves and 76 severe crashes in each category Phase I and II - 5,725 intersections included in analysis of each risk factor. Minimum of 150 intersections and 16 severe crashes in each category Intersection Risk Criteria
Project Development – Urban Signalized Intersections • 115/220 had 5 or 6 Stars • 24/115 are on Lake St • 9/115 are on Penn Ave • 9/115 are on Broadway Ave • 9/115 are on Cedar Ave • 8/115 are on Lyndale Ave • 7/115 are on Lowry Ave • 7/115 are on Franklin Ave Risk Factor Ranking Corridor Projects Over 60% of the at-risk intersections occurred on only a few urban corridors
Project Development – Urban Signalized Intersections Focus of Project Development is on adding Confirmation Lights because the density of severe right angle crashes does NOT appear to be related to the number of overhead indications.
Example Project Summary Sheets Rural Intersection Urban Intersection - Corridors
Rural County Project Summary Segments Curves Intersections
Urban County Project Summary Total Summary
What’s Next • Counties • Review, edit/concur with segment and intersection descriptions. • Begin assembling information about previous deployment of safety strategies; shoulder rumblestrips, 6” edgelines, street lights, chevrons, etc. • Next meetings • Safety Emphasis Areas Review Meeting in June 2012 • Ann Johnson (P.E. Services) will be in contact to assist with data gathering. • Start thinking about Workshop in July 2012
More Information • Mn/DOT State Aid website • www.dot.state.mn.us/stateaid • Fillmore County Safety Plan • http://www.dot.state.mn.us/stateaid/sa_county_traffic_safety_plans.html • Contact Information • Howard Preston, CH2M HILL, 651.365.8514, howard.preston@ch2m.com • Nikki Farrington, CH2M HILL, 651.365.8536, nicole.farrington@ch2m.com • Mike Marti, SRF Consulting Group, 763.249.6779, mmarti@srfconsulting.com • Carla Stueve, SRF Consulting Group, 765.249.6797, cstueve@srfconsulting.com • Renae Kuehl, SRF Consulting Group, 765.249.6783, rkuehl@srfconsulting.com • Ann Johnson, P.E. Services, 612.275.8190, johns421@umn.edu Questions?