Download
1 / 39
390 likes | 391 Vues
Chapter 03 The Concept of Elasticity and Consumer and Producer Surplus. Chapter Outline. Elasticity of Demand Alternative Ways of Understanding Elasticity More on Elasticity Consumer and Producer Surplus Kick It Up a Notch: Deadweight Loss. Elasticity.

E N D
Chapter 03The Concept of Elasticity and Consumer and Producer Surplus
ChapterOutline • Elasticity of Demand • Alternative Ways of Understanding Elasticity • More on Elasticity • Consumer and Producer Surplus • Kick It Up a Notch: Deadweight Loss
Elasticity • Elasticity: the responsiveness of quantity to a change in another variable • Price Elasticity of Demand: the responsiveness of quantity demanded to a change in price • Price Elasticity of Supply: the responsiveness of quantity supplied to a change in price • Income Elasticity of Demand: the responsiveness of quantity demanded to a change in income • Cross Price Elasticity of Demand: the responsiveness of quantity demanded of one good to a change in the price of another good
The Mathematical Representation of Elasticity ΔQ %ΔQ Q Elasticity = = %ΔP ΔP P Because the demand curve is downward sloping and the supply curve is upward sloping the elasticity of demand is negative and the elasticity of supply is positive. Often these signs are implicit and ignored.
Elasticity Labels • Elastic : the condition of demand when the percentage change in quantity is larger than the percentage change in price • Inelastic: the condition of demand when the percentage change in quantity is smaller than the percentage change in price • Unitary Elastic: the condition of demand when the percentage change in quantity is equal to the percentage change in price
The Graphical Explanation Alternative Ways to Understand Elasticity
The Relationship Between Slope and Elasticity • Elasticity and the slope of the demand curve are not the same but they are related. • At a given price level, elasticity is greater with a flatter demand curve. • With a linear demand curve (meaning a demand curve that has a single value for the slope) elasticity is greater at higher prices.
12.5% change (9-8)/8 P 13 12 11 10 9 8 7 6 5 4 3 2 1 0 25% change (4-3)/4 D1 1 2 3 4 5 6 7 8 9 10 11 12 13 Q/t Figure 1
Figure 2 50% change (12-8)/8 P 13 12 11 10 9 8 7 6 5 4 3 2 1 0 D2 25% change (4-3)/4 1 2 3 4 5 6 7 8 9 10 11 12 13 Q/t
12.5% change (9-8)/8 P 13 12 11 10 9 8 7 6 5 4 3 2 1 0 50% change (3-2)/2 A B Demand 25% change (4-3)/4 C 9.1% change (11-10)/11 D 1 2 3 4 5 6 7 8 9 10 11 12 13 Q/t Figure 3 Higher Prices Means Greater Elasticity
Alternative Ways to Understand Elasticity The Verbal Explanation • A good for which there are no good substitutes is likely to be one for which you must pay whatever price is charged. It is also likely to be one for which a lower price will not induce substantially greater consumption. Thus, as price changes there is very little change in consumption, i.e. demand is inelastic and the demand curve is steep. • Inexpensive goods that take up little of your income can change in price and your consumption will not change dramatically. Thus, at low prices, demand is inelastic.
Seeing Elasticity Through Total Expenditures • Total Expenditure Rule:if the price and the amount you spend both go in the same direction then demand is inelastic while if they go in opposite directions demand is elastic.
Determinants of Elasticity • Number of and Closeness of Substitutes • The more alternatives you have the less likely you are to pay high prices for a good and the more likely you are to settle for something that will do. • Time • The longer you have to come up with alternatives to paying high prices the more likely it is you will shift to those alternatives. • Portion of the Budget • The greater the portion of the budget an item takes up, the greater the elasticity is likely to be.
Extremes of Elasticity • Perfectly Inelastic: the condition of demand when price changes have no effect on quantity • Perfectly Elastic: the condition of demand when price cannot change
How the Elasticity of Demand Affects Reactions to Price Changes Elasticity and the Demand Curve
P S2 P2 S1 P1 D Q1=Q2 Q/t Figure 4 Perfectly Inelastic Demand
P S2 S1 P1=P2 D Q2 Q1 Q/t Figure 5 Perfectly Elastic Demand
P S2 S1 P2 P1 D Q2 Q1 Q/t Figure 6 Inelastic Demand (at moderate prices)
P S2 S1 P2 P1 D Q2 Q1 Figure 7 Elastic Demand(at moderate prices) Q/t
Price Elasticity Supply • Identical in concept to elasticity of demand. • Formula is the Same • It is also related to the slope of the supply curve but is not simply the slope of the supply curve. • Terminology is the same
Perfectly Inelastic Supply P S P2 P1 D2 D1 Q/t Q1=Q2
Inelastic Supply P S P2 P1 D2 D1 Q1 Q2 Q/t
Elastic Supply P S P2 P1 D2 D1 Q/t Q1 Q2
Perfectly Elastic Supply P P1=P2 S D2 D1 Q/t Q1 Q2
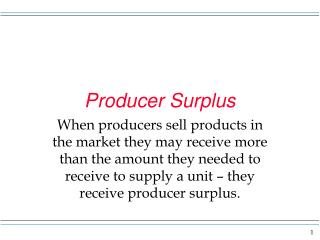
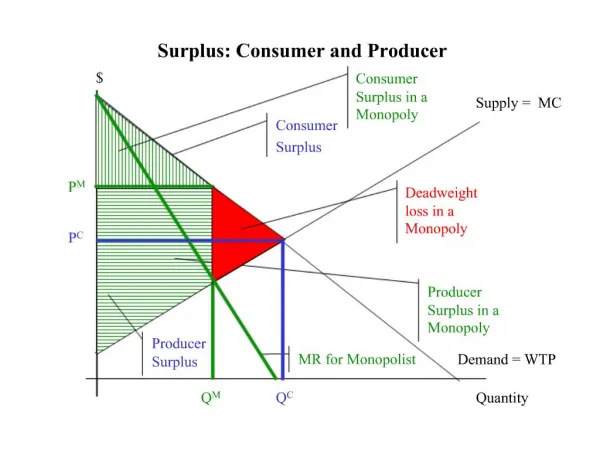
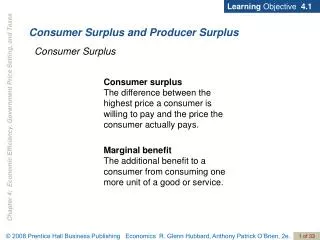
Consumer and Producer Surplus • Consumer Surplus: the value you get that is in excess of what you pay to get it • On a graph, consumer surplus is the area below the demand curve and above the price line. • Producer Surplus:the money the firm gets that is in excess of its marginal costs • On a graph, producer surplus is the area below the price line and above the supply curve.
P Supply A C P* B Demand 0 Q* Figure 12 Value to the Consumer: OACQ* Q/t
Figure 12 Money Consumers Pay Producers: OP*CQ* P Supply A C P* B Demand Q/t 0 Q*
P Consumer Surplus = = minus A Supply Amount Consumer pays producer C P* Value to the Consumer B Demand 0 Q* Q/t Figure 12 Consumer Surplus: P*AC
Figure 13 Variable Cost to the Producer: OBCQ* P Supply A C P* B Demand 0 Q*
Figure 13 Producer Surplus: BP*C Producer Surplus = minus = P A Supply Amount consumer pays producer C P* B Demand Variable cost to producer 0 Q* Q/t
Figure 14 Net Benefit to Society = CS+PS: BAC P Consumer Surplus Supply A C Producer Surplus P* B Demand 0 Q* Q/t
Market Failure • Market Failure: the circumstance where the market outcome is not the economically efficient outcome • Possible Sources: • Consumption or production can harm an innocent third party. • A good may not be one for which a company can profit from selling it though society profits from its existence. • The buyer may not be able to make a well-informed choice. • A buyer or seller may have too much power over the price.
Categorizing Goods:Exclusivity and Rivalry • Exclusivity: the degree to which the consumption of the good can be restricted by a seller to only those who pay for it • Rivalry: the degree to which one person’s consumption reduces the value of the good for the next consumer
Private and Public Goods • Purely private good: a good with the characteristics of both exclusivity and rivalry • Purely public good: a good with the neither of the characteristics exclusivity and rivalry • Excludable public good: a good with the characteristic of exclusivity but not of rivalry • Congestible public good: a good with the characteristic of rivalry but not of exclusivity
Consumer and Producer Surplus in a Supply and Demand Model Kick it Up a Notch
The Optimality of Equilibrium and Dead Weight Loss • At equilibrium the sum of producer and consumer surplus is as big as it can be (ABC). • Away from equilibrium the sum of producer and consumer surplus is smaller. The degree to which it is smaller is called the dead weight loss. That is, it is the loss in societal welfare associated with production being too little or too great.
P Supply A E P’ P* C F B Demand 0 Q’ Q* Q/t Figure 16 Dead Weight Loss When the Price is Above P* • Value to the Consumer: • 0AEQ’ • Consumers Pay Producers: • OP’EQ’ • The Variable Cost to Producers: • OBFQ’ • Consumer Surplus: • P’AE • Producer Surplus: • BP’EF • DWL • FEC
P Supply A P* E C P’ F B Demand 0 Q’ Q* Q/t Figure 17 Dead Weight Loss When the Price is Below P* • Value to the Consumer: • 0AEQ’ • Consumers Pay Producers: • OP’FQ’ • The Variable Cost to • Producers: • OBFQ’ • Consumer Surplus: • P’AEF • Producer Surplus: • BP’F • DWL • FEC