Download
1 / 1
10 likes | 113 Vues
Objective. Result. Conclusion and Future W ork.

E N D
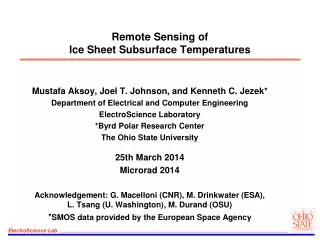
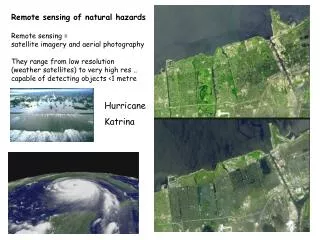
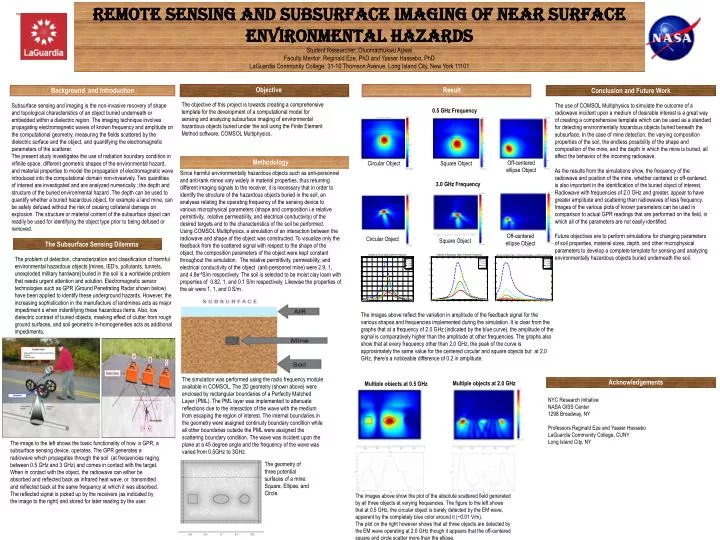
Objective Result Conclusion and Future Work The objective of this project is towards creating a comprehensive template for the development of a computational model for sensing and analyzing subsurface imaging of environmental hazardous objects buried under the soil using the Finite Element Method software, COMSOL Multiphysics. Methodology Acknowledgements NYC Research Initiative NASA GISS Center 1298 Broadway, NY Professors Reginald Eze and Yasser Hassebo LaGuardia Community College, CUNY Long Island City, NY REMOTE SENSING AND SUBSURFACE IMAGING OF NEAR SURFACE ENVIRONMENTAL HAZARDS Student Researcher: Oluomachukwu Agwai Faculty Mentor: Reginald Eze, PhD and Yasser Hassebo, PhD LaGuardia Community College: 31-10 Thomson Avenue, Long Island City, New York 11101 Background and Introduction Subsurface sensing and imaging is the non-invasive recovery of shape and topological characteristics of an object buried underneath or embedded within a dielectric region. The imaging technique involves propagating electromagnetic waves of known frequency and amplitude on the computational geometry, measuring the fields scattered by the dielectric surface and the object, and quantifying the electromagnetic parameters of the scatterer. The present study investigates the use of radiation boundary condition in infinite space, different geometric shapes of the environmental hazard, and material properties to model the propagation of electromagnetic wave introduced into the computational domain non-invasively. Two quantities of interest are investigated and are analyzed numerically.; the depth and structure of the buried environmental hazard .The depth can be used to quantify whether a buried hazardous object, for example a land mine, can be safely defused without the risk of causing collateral damage on explosion. The structure or material content of the subsurface object can readily be used for identifying the object type prior to being defused or removed. The use of COMSOL Multiphysics to simulate the outcome of a radiowave incident upon a medium of desirable interest is a great way of creating a comprehensive template which can be used as a standard for detecting environmentally hazardous objects buried beneath the subsurface. In the case of mine detection, the varying composition properties of the soil, the endless possibility of the shape and composition of the mine, and the depth in which the mine is buried, all affect the behavior of the incoming radiowave. As the results from the simulations show, the frequency of the radiowave and position of the mine, whether centered or off-centered, is also important in the identification of the buried object of interest. Radiowave with frequencies of 2.0 GHz and greater, appear to have greater amplitude and scattering than radiowaves of less frequency. Images of the various plots of known parameters can be used in comparison to actual GPR readings that are performed on the field, in which all of the parameters are not easily identified. Future objectives are to perform simulations for changing parameters of soil properties, material sizes, depth, and other microphysical parameters to develop a complete template for sensing and analyzing environmentally hazardous objects buried underneath the soil. 0.5 GHz Frequency Off-centered ellipse Object Circular Object Square Object Since harmful environmentally hazardous objects such as anti-personnel and anti-tank mines vary widely in material properties, thus returning different imaging signals to the receiver, it is necessary that in order to identify the structure of the hazardous objects buried in the soil, an analyses relating the operating frequency of the sensing device to various microphysical parameters (shape and composition i.e relative permittivity, relative permeability, and electrical conductivity) of the desired targets and to the characteristics of the soil be performed. Using COMSOL Multiphysics, a simulation of an interaction between the radiowave and shape of the object was constructed. To visualize only the feedback from the scattered signal with respect to the shape of the object, the composition parameters of the object were kept constant throughout the simulation. The relative permittivity, permeability, and electrical conductivity of the object (anti-personnel mine) were 2.9, 1, and 4.8e-4S/m respectively. The soil is selected to be moist clay loam with properties of 0.82, 1, and 0.1 S/m respectively. Likewise the properties of the air were 1, 1, and 0 S/m . 3.0 GHz Frequency Off-centered ellipse Object Circular Object Square Object The Subsurface Sensing Dilemma The problem of detection, characterization and classification of harmful environmental hazardous objects [mines, IED’s, pollutants, tunnels, unexploded military hardware] buried in the soil is a worldwide problem that needs urgent attention and solution. Electromagnetic sensor technologies such as GPR (Ground Penetrating Radar shown below) have been applied to identify these underground hazards. However, the increasing sophistication in the manufacture of landmines acts as major impediment s when indentifying these hazardous items. Also, low dielectric contrast of buried objects, masking effect of clutter from rough ground surfaces, and soil geometric in-homogeneities acts as additional impediments. The images above reflect the variation in amplitude of the feedback signal for the various shapes and frequencies implemented during the simulation. It is clear from the graphs that at a frequency of 2.0 GHz (indicated by the blue curve), the amplitude of the signal is comparatively higher than the amplitude at other frequencies. The graphs also show that at every frequency other than 2.0 GHz, the peak of the curve is approximately the same value for the centered circular and square objects but at 2.0 GHz, there’s a noticeable difference of 0.2 in amplitude. The simulation was performed using the radio frequency module available in COMSOL. The 2D geometry (shown above) were enclosed by rectangular boundaries of a Perfectly Matched Layer (PML). The PML layer was implemented to attenuate reflections due to the interaction of the wave with the medium from escaping the region of interest. The internal boundaries in the geometry were assigned continuity boundary condition while all other boundaries outside the PML were assigned the scattering boundary condition. The wave was incident upon the plane at a 45 degree angle and the frequency of the wave was varied from 0.5GHz to 3GHz. Multiple objects at 2.0 GHz Multiple objects at 0.5 GHz The image to the left shows the basic functionality of how a GPR, a subsurface sensing device, operates. The GPR generates a radiowave which propagates through the soil (at frequencies raging between 0.5 GHz and 3 GHz) and comes in contact with the target. When in contact with the object, the radiowave can either be absorbed and reflected back as infrared heat wave, or transmitted and reflected back at the same frequency at which it was absorbed. The reflected signal is picked up by the receivers (as indicated by the image to the right) and stored for later reading by the user. The geometry of three potential surfaces of a mine: Square, Ellipse, and Circle. The images above show the plot of the absolute scattered field generated by all three objects at varying frequencies. The figure to the left shows that at 0.5 GHz, the circular object is barely detected by the EM wave, apparent by the completely blue color around it (~0.01 V/m). The plot on the right however shows that all three objects are detected by the EM wave operating at 2.0 GHz though it appears that the off-centered square and circle scatter more than the ellipse.