Download
1 / 19
190 likes | 313 Vues
Mapping of Topographic Effects on Maximum Sustained Surface wind Speeds in Landfalling Hurricanes. Dr Craig Miller University of Western Ontario. Observed Damage Due to Topographic Effects on Surface Wind Speeds.

E N D
Mapping of Topographic Effects on Maximum Sustained Surface wind Speeds in Landfalling Hurricanes Dr Craig Miller University of Western Ontario
Observed Damage Due to Topographic Effects on Surface Wind Speeds • Very little is known about the effects of topography on surface wind speeds in tropical cyclones • What information we do have consists of largely qualitative observations from a number of storms, including: • Tropical Cyclone Winifred (1986) • Hurricane Iniki (1992) • Hurricane Marilyn (1995) • Super-Typhoon Paka (1997) • Tropical Cyclone Larry (2006)
Observed Damage to Structures in Tropical Cyclone Larry Source: Tropical Cyclone Larry – Damage to buildings in the Innisfail area, Technical Report 51, Cyclone Testing Station, James Cook University, September 2006
Pre-1982 structure Impact of Topographic Effects on Structures Post-1982 structure built without allowance for topographic effects Innisfail, Queensland after Cyclone Larry, March 2006
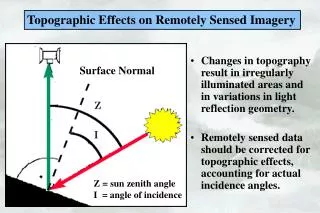
Factors That Influence Topographic Speed-up Effects • Slope of topography in direction wind is blowing • Surface roughness • increasing surface roughness leads to larger speed-ups • Whether topography is 2-D (ridge) or 3-D (hill) • speed-up is reduced if topography is 3-D • Onset of flow separation places an upper limit on the maximum speed-up • depends on both slope and surface roughness
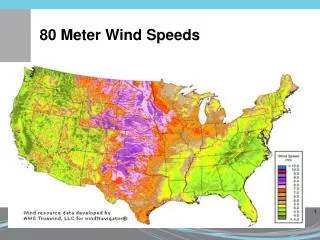
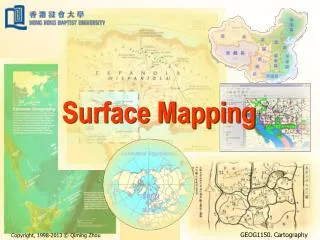
Calculation of Topographic Effects • Topographic effects calculated using MS-Micro linear model for boundary layer flow over small-scale topography, in combination with high resolution digital elevation models of Puerto Rico and the US Virgin Islands • Directionally dependent speed-up factors calculated on a grid with a horizontal resolution of 240 m (USVI) or 990 m (Puerto Rico) • Elevation of 10 m above local ground • Eight wind directions spaced at 45o angles
Linear vs Non-linear Predictions of Speed-up over Askervein Hill, Outer Hebrides Source: Walmsley and Taylor (1996)
Directional Speed-up Maps For St Thomas, USVI Wind direction 90o
Directional Speed-up Maps For St Thomas, USVI Wind direction 180o
Development of a Topographic Speed-up Mapping Tool • Developed using MapWindow open source GIS package • User selects an island, track heading and maximum sustained wind speed before plotting topographically enhanced wind speeds • Wind speeds can be displayed in either 5 kt increments or by Saffir-Simpson category • Major roads and population centres can be overlaid on wind speed map • Potential to use surface wind fields from other sources (H*WIND, HWRF, etc)
Validation of Approach - Hurricane Fabian (2003) on Bermuda • Eastern eyewall of Hurricane Fabian passed over the island of Bermuda on 5 September, 2003 • Topography of Bermuda consists of low rolling hills, rising to 76 m above sea level at their highest point • Roof damage to structures mapped using high-resolution satellite imagery, and then correlated to 1-minute mean wind speeds obtained from H*WIND, with and without the effects of topography included
Mapping of Roof Damage • Base layer showing building footprints from Bermuda Ministry of Works and Engineering combined with georeferenced Quickbird satellite imagery • Calculated the percentage of the building footprint area covered by blue pixels (inferred to be tarpaulins)
Calculation of Surface Wind Speeds • Surface wind speeds calculated using H*WIND surface wind field analyses • Data available at: • 13:30 Z • 19:30 Z • 20:00 Z • 23:03 Z • Interpolated to 15 minute intervals to capture maximum 1-minute wind speeds
Correlation of Damage to Topographically Enhanced Wind Speeds
Summary • Topographic speed-up effects can have a significant effect on surface wind speeds in landfalling hurricanes • Linear model of boundary layer flow over topography used to map directional topographic speed-up factors for Puerto Rico and US Virgin Islands • GIS based mapping tool developed to display topographically enhanced wind speeds given a track heading and maximum sustained over-water wind speed
Acknowledgements • Jack Beven (NHC/TPC) • Kimberly Mueller (Risk Management Solutions) • Auguse Boissonnade (Risk Management Solutions) • Kyle Beatty (Willis Re)