Download
1 / 39
390 likes | 782 Vues
Mapping (Topographic) Surveys. Required:. Readings: 16-1 to 16-9.1 &16-9.5 Figures: 16-1 to 16-4. Recommended, not required, extra readings: Hydrographic Surveys section 16-12. Topographic Maps. Topographic surveys, why? Planimetric vs hypsometric maps.

E N D
Required: • Readings: 16-1 to 16-9.1 &16-9.5 • Figures: 16-1 to 16-4. • Recommended, not required, extra readings: • Hydrographic Surveys section 16-12.
Topographic Maps • Topographic surveys, why? • Planimetric vs hypsometric maps. • A combination of Planimetric and hypsometric maps is a topographic map. • DEMs and three dimensional perspective models.
Methods for Mapping (Topographic) Surveys • Small areas: ground surveys.
Large areas: • -photogrammetry and Remote Sensing, automatic. With ground survey for control, GPS? • Overlapped images from a plane, geometry is solved, images are oriented , and finally 3D models are produced and digitized to produce maps.
Large areas:LIDAR • Terrain mapping using scanning airborne laser radar (LIDAR): the aircraft is simply transformed into the equivalent of an airborne total station by combining laser range-finder technology with GPS and inertia systems • Knowing the aircraft position (GPS) and orientation, the distance to the ground point, and the angular orientation of the laser beam, the position of a point on the earth’s surface can be found. • Several footprints of laser are available to perform various tasks. For example, large footprints VS small footprints in forested and bare-ground areas.
LIDAR DEM USGS DEM LIDAR Terrain Mapping in Forests
LIDAR Canopy Model (1 m resolution) WHOA!
Canopy Surface Model Minus Terrain Surface Model =
LIDAR Vegetation Height Model (LIDAR Canopy minus LIDAR Ground DEM) Canopy Height (m)
LIDAR data visualization Click on image
LIDAR Data Visualization Click on image Raw LIDAR point cloud, Capitol Forest, WA LIDAR points colored by orthophotograph FUSION visualization software developed for point cloud display & measurement
Oblique aerial view, courtesy of Washington Dept. of Ecology
Perspective shaded-relief view of 10m DEM, derived from 1:24,000-scale contours
Interpreted LIDAR DEM. Yellow is landslide, pink is scarp, green and violet are glacially-scoured surface Source: http://pugetsoundlidar.ess.washington.edu/example1.htm
Control for Topographic Surveys • Horizontal: traversing, triangulation, GPS, extended with photogrammetry in large areas. • Vertical: leveling loops, GPS. • Control points are the framework upon which the topographic details are usually built. Must be: • Within the allowable misclosure. • Checked and adjusted.
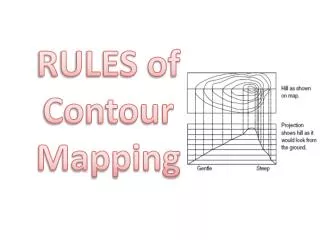
Contour Lines • Lines connecting points of equal elevations, such as a shoreline of a lake. • Contour Interval: the vertical distance between level surfaces forming the contours. 1, 2, 5 ft • Contour intervals depend on map scale and the diversity of relief in the area. • Every fifth contour is drawn • with a heavier line, elevations • are in breaks in the contour • lines. • Next slide then figure 16-2
Characteristics of Contours • Must close on themselves, on or off the map • Perpendicular to the direction of max. Slope • Slope between them is assumed uniform • The distance between them indicates the steepness of the slope, gentle or steep • Irregular signify rough, smooth signify gradual slopes
Characteristics of Contours • Concentric closed contours: hills or depression • They do not cross each other, only in special cases • They do not cross buildings • They cross horizontal man made surfaces in parallel lines
Locating Contours • Direct method: locate the points of certain elevation. Keep a certain rod reading from horizontal line of site, trace and locate points on contour line. • Indirect method: measure the elevation and location of “controlling points”. Interpolate to locate contours. Interpolate at each side of controlling features separately. • Slide 16-4.
Automated Contouring Systems • DTM (DEM): digital elevation (terrain) models. • Array of points with measured X, Y, and Z. • Grid method: borrow pit, computer interpolation. • Irregular method: indirect method, with additional information to produce triangulated irregular network. • Assuming the triangle sides are of constant slopes, interpolate along the sides.
Breaklines: • linear Topographic features which have uniform slopes. • Must be triangle sides. • For example: notice how roads are shown in the TIN and in the contours.
Field Methods for Locating Topographic Details • Radiation by total station: measure angle and distance to each feature. X, Y, Z of the surveyed point can be displayed in real time. • Grid method: suitable for contours. • GPS: Must maintain satellite Visibility. Will not work efficiently close to building or Under trees.
Accuracy Specifications for Topographic Surveys • More than one standards:national map accuracy standards (NMAS), ASPRS, American Society of Civil Engineers (ASCE) • Maximum permitted errors are related to map scale. The smaller the scale the bigger the allowed error. • Example: not more than 10% of tested points shall be in error in horizontal position by more than 1/30 inch, what about a map 1 in: 100 ft
Project 2 • Map the site of project 1, extend it to the edges of vegetation. • Map every thing that DOES NOT MOVES, big or small. • Use known control stations and coordinate. Keep good sketches. • Contours: interpolated from project 1 earthwork grid, extend it to the limits by hand. • Check out: TS, battery “check the charge before you leave, tripod, prism or two, prism pole or two, tape measure, Radios • TOB: TS on point 36, first point in table is 20, must give reference azimuth
X X Contour lines of problem 16-12