Download
1 / 31
310 likes | 433 Vues
: Subject Measurement-calibrated Graph Models for Social Network Experiments Peresenters : Aida Parbale Serve Rashidian Somaieh Shahrokhi. Measurement-Calibrated Graph Models For Social Network Experiments. Index. INTRODUCTION METHODOLOGY AND CHALLENGES

E N D
:Subject Measurement-calibrated Graph Models for Social Network Experiments Peresenters: Aida Parbale Serve Rashidian SomaiehShahrokhi Azad University of Kurdistan
Measurement-Calibrated Graph Models For Social Network Experiments Azad University of Kurdistan
Index INTRODUCTION METHODOLOGY AND CHALLENGES Collecting Social Graphs Fitting Models to Target Graphs Evaluating Model Fidelity SOCIAL GRAPHMODEL Feature-driven Models Intent-driven Models Azad University of Kurdistan
Introduction complex graph datasets is critical to researchon social networking systems and applications. Simulations ongraph data provide critical evaluation of new systems and applicationsranging from community detection to spam filtering andsocial web search. Azad University of Kurdistan
Methodology And Challenge goal is to identify which graph models, if any, can generate synthetic graphs that are sufficiently representative of real-world social graphs to be suitable for experimental research. Azad University of Kurdistan
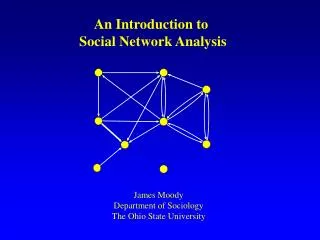
Collecting Social Graph Facebookis the largest social network in the world with more than 350 million users. We use several Facebooksocial graphs we obtained through detailed measurements between March and May 2008.Our data includes anonymizedsocial graphs encompassing more than 10 million users with over 940 million social links from the 22 largest regional networks,aswell as several smaller regional networks. Azad University of Kurdistan
Fitting Models To Target Graphs compare the fidelity of different models to determine their suitability as replacements for measured social graphs. For each model,use social graphs from Facebook as targets, and determine the optimal model parameters that provide the best fit for the model and a given graph.We then use these parameters to generate randomized graphs that attempt to match the target graph’s salient graph properties. Azad University of Kurdistan
Evaluating Model Fidelity Finally, once we have computed the best fit parameters for a given model and target graph, we can compute the fidelity of the model with respect to a given metric. The final challenge is identifying the correct metric(s) that capture the properties of interest to experimental research Azad University of Kurdistan
SOCIAL GRAPHMODEL divide these models into three classes: feature-driven models Intent-driven models Structure-driven models Azad University of Kurdistan
Feature-driven Models Barabasi-Albert Barabasiand Albert proposed the classical model which produces graphs with power-law degree distributions missing from random graphs. Forest Fire Leskovecet al. observed increases in density and decreases in diameter over time in graphs such as the patent citation graph and Internet AS connectivity graph .Tocapture these dynamic effects, they propose the Forest Fire model Azad University of Kurdistan
Intent-driven Models RandomWalk The Random Walk model emulates the randomized walk behavior of friend discovery in online social networks. Nearest Neighbor Another model based on social behaviors is the Nearest Neighbor model. It follows the observation that two people sharing a common friend are more likely to become friends. Azad University of Kurdistan
FITTING MODELS TO GRAPHS Maximum likelihood estimation (MLE) is the best-known statistical method for fitting a statistical model to data and estimating a model’s parameters. Applying MLE to graph model fitting, however, is very difficult. For large graphs like ours, there are no efficient solutions to determine if two graphs are physically identical.Thisis the well-known graph isomorphism problem. Azad University of Kurdistan
Instead, we propose to use a parameter-search based solution by scanning the possible parameter space, and guiding the search using a statistical similarity metric between the target graph and the model generated graphs. Implementing this solution requires us to solve two technical challenges. First, we need a metric to measure the statistical difference between graphs, for which we propose to leverage the dKseries, a graph distribution that captures subgraph degree distributions. Second, we need an efficient strategy to search through the large parameter space to quickly locate near-optimal parameters.Forthis we propose a space-sampling solution with adaptive precision. Azad University of Kurdistan
Parameter Sampling with Adaptive Precision Hill climbing starts from a random (potentially poor) solution, and iteratively improves the solution by making small changes until no more improvements are found. Hill climbing does not work well for nonconvex spaces, however, since it will terminate when it finds a local maxima. We have experimented with hill climbing in our model fitting problem, and confirmed that it produces suboptimal results because the similarity metric (dK or others) is not strictly convex. To overcome this problem, we apply a sampling method that finds the best fit parameters by uniformly scanning the possible parameter space given a reasonable constraint on the level of precision. Azad University of Kurdistan
Fitting Algorithms in Detail Nearest Neighbor: Our modified Nearest Neighbor model has two parameters: 0 < u < 1, and k = 1, 2, 3, · · · Azad University of Kurdistan
Random Walk : The modified model has two parameters to tune: 0 < qe < 1 and 0 < qv < 1 Forest Fire : The Forest Fire model has only a single parameter,p the burn rate. Barabasi-Albert :This model has only one unknown parameter m m = |E|/n Azad University of Kurdistan
FIDELITY UNDER GRAPH METRICS 1. Node Degree Distribution (NDD): Social degree refers to the number of friends (or edges) each node has. Measurements show that node degree distributions in social graphs follow a power-law distribution, i.e. the fraction P(k) of nodes in the graph having k connections to other nodes grows as P(k) ~k−ˠ, where ɣ is a constant exponent. 2. Joint Degree Distribution : There are several different ways to capture the joint degree distribution, including the knn function,assortativity, and the s-metric. Azad University of Kurdistan
3. Clustering Coefficient (CC) : Clustering coefficient measures whether social graphs conform to the small-world principle. It is defined as the ratio of the number of links that exist between a node’s immediate neighborhood and the maximum number of links that could exist. For a node x with degree dx, at most dx(dx−1)/2 edges can exist among x’s friends (when they form a complete clique). Let kx be the actual number of edges among x’sfriends,theclustering coefficient of node x is 2kx /dx(dx−1) . Azad University of Kurdistan
4. Node Separation : The degree of node separation is measured through three metrics: average path length, network radius and network diameter. Azad University of Kurdistan
Graph Metric Results Azad University of Kurdistan
APPLICATION FIDELITY BENCHMARKS Since we do not yet understand how graph metrics impact different social applications, the final measure of a model’s fidelity must still rely on application-level benchmarks We chose “Reliable Email” , “Sybil guard” and a “Social Shield Anonymous System” as representative social network applications. Azad University of Kurdistan
RE: Reliable Email is a white list system for email that securely marks emails from a user’s friends and friends-of friends as non-spam messages Allowing them to bypass spam filters. A meaningful evaluation experiment is to examine the level of potential impact on RE users if accounts in the social network were compromised using phishing attacks. Compromised accounts can flood spam email through the RE system, since their spam bypasses filters and directly reaches user’s inboxes. Azad University of Kurdistan
We perform these experiments on our Face book social graphs,and plot the results for Santa Barbara, Egypt, and New York in Figure 5, and list Euclidean distance values for all 4 graphs in column 7of Table 4. Comparing results across all graphs, Nearest Neighbor produces the overall best results, with dK-2 and Random Walk as the next best models. Azad University of Kurdistan
Social shields for anonymous communication Puttaswamy et al. propose using social neighborhoods to protect users of anonymous communication protocols against passive loggingattacks .Most anonymous routing protocols provide anonymity by forwarding traffic through a random sequence of relay nodes. Azad University of Kurdistan
Sybil guard: A malicious user in an online community canlaunch a Sybilattack by creating a large number of virtual identities. These identities can then work together to provide the owner with some unfair advantage, by outvoting legitimate users in consensus systems, corrupting data in distributed storage systems, or manipulating incentive systems or reputation systems to perform fraud. Sybil Guard proposes a way to detect these Sybil identities using social networks. Azad University of Kurdistan
Interaction Graphs: An interaction graph is a social graph in which edges that do not receive interactions between the two endpoints are culled.Inour case, interactions are defined as wall posts or photo comment activity. Intuitively, this process removes unimportant edges from the graph, leaving only active edges that are relevant when designing and testing “user-driven” applications. Azad University of Kurdistan
Final Considerations: A final take-away from our tests is that despite significant variance in model accuracy, we find that Nearest Neighbor consistently outperforms its competitors in producing synthetic graphs that not only capture the majority of known graph metrics, but also accurately predict the performance of application level tests such as RE, Sybil guard, and Social Shields. Based on our graph metric and application level tests, we conclude that the Nearest Neighbor model is a viable candidate for researchers looking to replace real graphs with model-generated graphs. Azad University of Kurdistan
7. RELATED WORK Trace-driven models OSN measurements Graph similarity Azad University of Kurdistan
DISCUSSION AND CONCLUSIONS We began this work as a search for practical solutions to challenges we faced while distributing measured social graphs to colleagues in the research community. While experiments using Tracedriven models are common in the study of both wired and wireless networks, an analogous approach has not been applied to research on social graphs. It became clear to us that measurement-calibrated graph modeling faced a number of challenges due to the Inherent complexity and scale of graphs. Azad University of Kurdistan
Through empirical experimentation, we find that structure-driven models such as dK and Kronecker are limited by high computational and memory complexity. The most consistently accurate model is our modified version of Nearest Neighbor, which despite its simple algorithm, manages to successfully capture key graph metrics of the original graph We conclude that graph models can be adequate replacements for real social graphs, and that current graph metrics cannot completely capture properties used by social network applications . Azad University of Kurdistan