Download
1 / 22
220 likes | 225 Vues
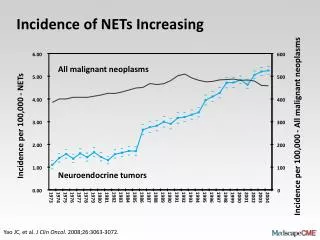
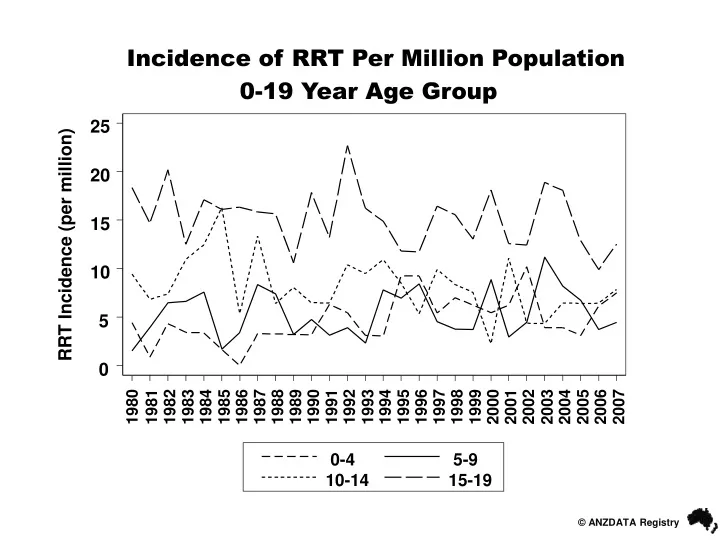
This dataset presents the incidence and prevalence of renal replacement therapy (RRT) per million population in the 0-19 year age group. It includes data from 1980 to 2007 and provides information on RRT incidence, prevalence, age at transplant, donor source, HLA mismatches, time to first kidney transplant, recipient and graft survival, use of calcineurin and mTOR inhibitors, and use of antimetabolites.

E N D
Incidence of RRT Per Million Population 0-19 Year Age Group 25 20 15 RRT Incidence (per million) 10 5 0 1980 1981 1982 1983 1984 1985 1986 1987 1988 1989 1990 1991 1992 1993 1994 1995 1996 1997 1998 1999 2000 2001 2002 2003 2004 2005 2006 2007 0-4 5-9 10-14 15-19
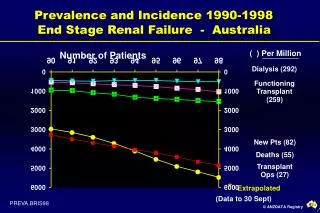
100 80 60 RRT Prevalence (per million) 40 20 0 1980 1981 1982 1983 1984 1985 1986 1987 1988 1989 1990 1991 1992 1993 1994 1995 1996 1997 1998 1999 2000 2001 2002 2003 2004 2005 2006 2007 0-4 5-9 10-14 15-19 Prevalence of RRT Per Million Population 0-19 Year Age Group
Age (Years) at Transplant 1996-2007 100 30 34 39 39 40 80 44 15-19 60 28 10-14 26 Percent 20 19 25 19 5-9 40 16 16 22 24 0-4 21 27 20 26 24 19 18 15 10 0 1996-97 1998-99 2000-01 2002-03 2004-05 2006-07
Donor Source 1996-2007 100 7 7 7 10 14 16 80 51 51 59 Other Live Donor 66 51 50 60 Percent Parent 40 Deceased Donor 42 39 20 35 34 34 27 0 1996-97 1998-99 2000-01 2002-03 2004-05 2006-07
Number of HLA Mismatches 1996-2007 100 7 8 9 10 10 13 80 37 40 41 5-6 49 44 54 60 3-4 Percent 1-2 40 46 51 0 46 39 41 31 20 6 5 4 4 3 1 0 1996-97 1998-99 2000-01 2002-03 2004-05 2006-07
Time to First Kidney Transplant 1996-2007 100 5 7 10 10 12 12 27 80 24 36 36 33 34 >=3 years 60 1-3 years Percent 37 37 0-1 year 29 40 30 39 35 Pre-emptive 20 31 30 25 23 19 18 0 1996-97 1998-99 2000-01 2002-03 2004-05 2006-07
Recipient Survival 1.00 0.90 Probability of Survival 1996-97 (95) 0.80 1998-99 (75) 2000-01 (81) 2002-03 (102) 2004-05 (107) 2006-07 (69) 0.70 0 1 2 3 4 5 Years
Graft Survival 1.00 0.90 Probability of Survival 1996-97 (95) 0.80 1998-99 (75) 2000-01 (81) 2002-03 (102) 2004-05 (107) 2006-07 (69) 0.70 0 1 2 3 4 5 Years
Calcineurin and mTOR Inhibitors at Induction Transplant Cohorts 1996-2007 0 0 0 0 0 0 0 0 0 0 0 0 0 2 100 2 6 21 24 31 80 44 45 53 57 65 60 95 96 Percent 93 92 77 73 40 65 53 56 44 40 20 35 5 5 4 4 3 3 3 2 2 2 0 0 0 1996 1997 1998 1999 2000 2001 2002 2003 2004 2005 2006 2007 Neither Cyclosporine Tacrolimus mTOR Inhibitor
Calcineurin and mTOR Inhibitors at One Year Transplant Cohorts 1996-2006 0 2 0 0 0 0 100 3 4 5 5 15 17 23 24 28 38 80 72 64 69 60 60 Percent 67 93 88 57 70 40 69 63 20 28 25 28 19 12 20 6 6 5 4 4 3 3 2 0 0 0 0 1996 1997 1998 1999 2000 2001 2002 2003 2004 2005 2006 Neither Cyclosporine Tacrolimus mTOR Inhibitor
Calcineurin and mTOR Inhibitors at Five Years Transplant Cohorts 1996-2002 0 0 0 100 4 8 14 17 29 33 80 50 42 47 60 Percent 66 73 58 40 64 42 47 45 20 17 11 13 13 3 3 3 0 0 0 1996 1997 1998 1999 2000 2001 2002 Neither Cyclosporine Tacrolimus mTOR Inhibitor
Calcineurin and mTOR Inhibitors at Ten Years Transplant Cohorts 1996-1997 100 7 21 42 80 60 Percent 21 50 40 29 20 21 8 0 1996 1997 Neither Cyclosporine Tacrolimus mTOR Inhibitor
Antimetabolites at Induction Transplant Cohorts 1996-2007 2 100 24 80 69 75 79 81 60 92 93 94 Percent 97 94 98 100 71 40 20 26 19 18 19 2 3 4 6 4 6 5 4 4 4 3 2 2 0 0 0 0 0 0 1996 1997 1998 1999 2000 2001 2002 2003 2004 2005 2006 2007 None Azathioprine Mycophenolate
Antimetabolites at One Year Transplant Cohorts 1996-2006 100 21 33 80 62 68 75 76 79 60 89 89 89 Percent 97 77 40 60 31 18 20 13 24 21 13 4 6 5 13 7 7 7 6 5 0 3 2 0 0 0 1996 1997 1998 1999 2000 2001 2002 2003 2004 2005 2006 None Azathioprine Mycophenolate
Antimetabolites at Five Years Transplant Cohorts 1996-2002 100 39 39 80 50 54 63 73 76 60 Percent 40 45 52 40 37 33 20 14 22 16 10 10 9 8 5 3 0 1996 1997 1998 1999 2000 2001 2002 None Azathioprine Mycophenolate
Antimetabolites at Ten Years Transplant Cohorts 1996-1997 100 80 54 58 60 Percent 40 32 29 20 14 13 0 1996 1997 None Azathioprine Mycophenolate
Steroid-free Fraction Transplant Cohorts 1996-2007 40 30 Percentage Prednisolone-free 20 10 0 1996 1997 1998 1999 2000 2001 2002 2003 2004 2005 2006 2007 Transplant Cohort Induction 6 months 1 year 3 years 5 years
Rejection <6 Months Post Transplant Transplant Cohorts 1997-2006 60 50 42 40 33 % With Rejection Within 6 Months 30 28 28 20 20 19 19 17 17 13 10 0 1997 1998 1999 2000 2001 2002 2003 2004 2005 2006 2007 Transplant Cohort
Diagnosis of Rejection Episodes <6 Months Transplant Cohorts 1997-2006 100 33 80 69 71 71 75 77 60 82 83 86 88 Percent 40 67 20 31 29 29 25 23 18 17 14 13 0 1997 1998 1999 2000 2001 2002 2003 2004 2005 2006 Clinically Diagnosed Biopsy Proven
Rejection >6 Months Post Transplant Transplant Cohorts 2003-2006 60 50 40 % With Rejection After 6 Months 30 21 20 15 13 10 6 2003 Cohort includes those from 01 October 2003 0 2003 2004 2005 2006 2007 Transplant Cohort
Diagnosis of Rejection Episodes >6 Months Transplant Cohorts 2003-2006 100 25 80 50 64 71 60 Percent 40 75 50 20 36 29 0 2003 2004 2005 2006 Clinically Diagnosed Biopsy Proven 2003 Cohort includes those from 01 October 2003
80.0 75.0 Mean GFR 70.0 65.0 60.0 1 3 6 12 24 36 60 Months Post Transplant 1996-1998 1999-2001 2002-2004 Mean GFR Over Time Transplant Cohort 2005-2007