Download
1 / 62
620 likes | 825 Vues
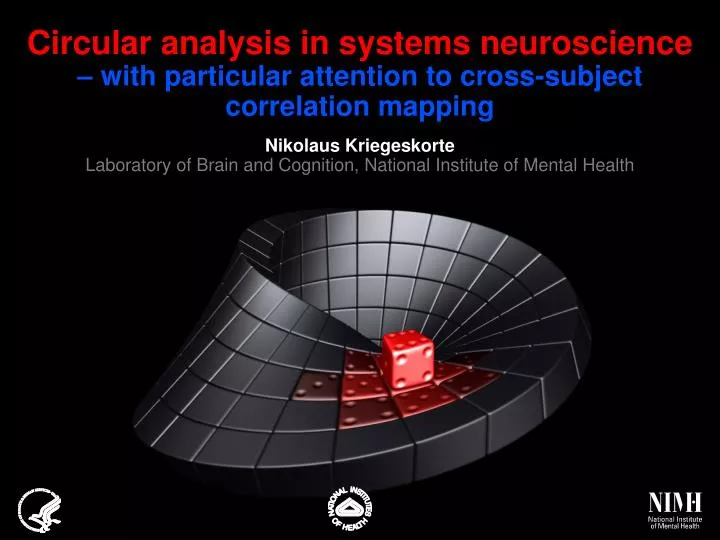
Circular analysis in systems neuroscience – with particular attention to cross-subject correlation mapping. Nikolaus Kriegeskorte Laboratory of Brain and Cognition, National Institute of Mental Health. Collaborators. Chris I Baker W Kyle Simmons Patrick SF Bellgowan Peter Bandettini.

E N D
Circular analysis in systems neuroscience– with particular attention to cross-subject correlation mapping Nikolaus Kriegeskorte Laboratory of Brain and Cognition, National Institute of Mental Health
Collaborators Chris I Baker W Kyle Simmons Patrick SF Bellgowan Peter Bandettini
Overview Part 1General introduction to circular analysis in systems neuroscience(synopsis of Kriegeskorte et al. 2009) Part 2Specific issue: selection bias incross-subject correlation mapping(following up on Vul et al. 2009)
data results
analysis data results
analysis data results
assumptions analysis data results
assumptions data results analysis
Circular inference assumptions analysis data results
Circular inference assumptions analysis data results
Weighting (continuous selection) Elimination (binary selection) Sorting (multiclass selection) How do assumptions tinge results? – Through variants of selection!
Elimination (binary selection) assumptions: selection criteria analysis data results
Experimental design TASK (property judgment) Simmons et al. 2006 “Animate?” “Pleasant?” STIMULUS (object category)
Pattern-information analysis define ROI by selecting ventral-temporal voxels for which any pairwise condition contrast is significant at p<.001 (uncorr.) perform nearest-neighbor classificationbased on activity-pattern correlation use oddruns for trainingand evenruns for testing
Results stimulus (object category) task (judged property) decoding accuracy chance level 1 0.5 0
stimulus task decoding accuracy chance level ! ? fMRI data data from Gaussian random generator using all data to select ROI voxels 1 1 1 1 ...but we used cleanly independent training and test data! using only training data to select ROI voxels 0.5 0.5 0.5 0.5 0 0 0 0
Conclusion for pattern-information analysis The test data must not be used in either... • training a classifier or • defining the ROI continuous weighting binary weighting
Data selection is key to many conventional analyses. Can it entail similar biases in other contexts?
ROI definition is affected by noise independent ROI overfitted ROI true region overestimated effect ROI-average activation
Data sorting assumptions: sorting criteria analysis data results
Set-average tuning curves ...for data sorted by tuning response stimulus parameter (e.g. orientation) noise data
ROI-average fMRI response A B C D condition Set-average activation profiles ...for data sorted by activation noise data
To avoid selection bias, we can... ...perform a nonselective analysis OR ...make sure that selection and results statistics are independent under the null hypothesis, because they are either: • inherently independent • or computed on independent data e.g. whole-brain mapping (no ROI analysis) e.g. independent contrasts
Does selection by an orthogonal contrast vector ensure unbiased analysis? cselection=[1 1]T ctest=[1 -1]T orthogonal contrast vectors ROI-definition contrast: A+B ROI-average analysis contrast: A-B
Does selection by an orthogonal contrast vector ensure unbiased analysis? contrast vector – No, there can still be bias. still not sufficient not sufficient The design and noise dependencies matter. design noise dependencies
Circular analysis Pros Cons • highly sensitive • widely accepted (examples in all high-impact journals) • doesn't require independent data sets • grants scientists independencefrom the data • allows smooth blending of blind faith and empiricism
Circular analysis Pros Cons • highly sensitive • widely accepted (examples in all high-impact journals) • doesn't require independent data sets • grants scientists independencefrom the data • allows smooth blending of blind faith and empiricism
Circular analysis Pros Pros Cons [can’t think of any right now] • the error that beautifies results • confirms even incorrect hypotheses • improves chances ofhigh-impact publication • highly sensitive • widely accepted (examples in all high-impact journals) • doesn't require independent data sets • grants scientists independencefrom the data • allows smooth blending of blind faith and empiricism
Part 2Specific issue: selection bias incross-subject correlation mapping(following up on Vul et al. 2009)
Motivation Vul et al. (2009) posed a puzzle: Why are the cross-subject correlations found in brain mapping so high? Selection bias is one piece of the puzzle. But there are more pieces and we have yet to put them all together.
Overview • List and discuss six pieces of the puzzle. (They don't all point in the same direction!) • Suggest some guidelines for good practice.
Six pieces synopsis • Cross-subject correlation estimates are very noisy. • Bin or within-subject averaging legitimately increases correlations. • Selecting among noisy estimates yields large biases. • False-positive regions are highly likely for a whole-brain mapping thresholded at p<.001, uncorrected. • Reported correlations are high, but not highly significant. • Studies have low power for finding realistic correlations in the brain if multiple testing is appropriately accounted for.
Vul et al. 2009 ,, noise-free correlation population ,, The geometric mean of the reliability is an upper bound on the population correlation. The reliabilities provide no bound on the sample correlation.
Piece 1 Sample correlationsacross small numbers of subjectsare very noisy estimatesof population correlations.
Cross-subject correlation estimatesare very noisy 95%-confidence interval correlation 10 subjects
Piece 2 The more we average(reducing noise but not signal),the higher correlations become.
Subjects are like bins... For each subject, all data is averaged to give one number. Take-home message Cross-subject correlation estimates are expected to be... • high (averaging all data for each subject) • noisy (low number of subjects) So what's Ed fussing about?We don't need selection bias to explain the high correlations, right?
Piece 3 Selecting the maximumamong noisy estimatesyields large selection biases.
Expected maximum correlationselected among null regions expected maximum correlation bias 16 subjects
Piece 4 False-positive regions are likely to be found in whole-brain mappingusing p<.001, uncorrected.
Mapping with p<.001, uncorrected Global null hypothesis is true (population correlation = 0 in all brain locations)