Download
1 / 2
20 likes | 135 Vues
ATLSS STRUCTURE. Across Trophic Level System Simulation. Snail Kite. Radio-telemetry Tracking Tools. Model Type. Wading Birds. Individual-Based Models. Constructing SESI Models. Florida Panther. ATLSS and the Planning Process for Everglades Restoration .

E N D
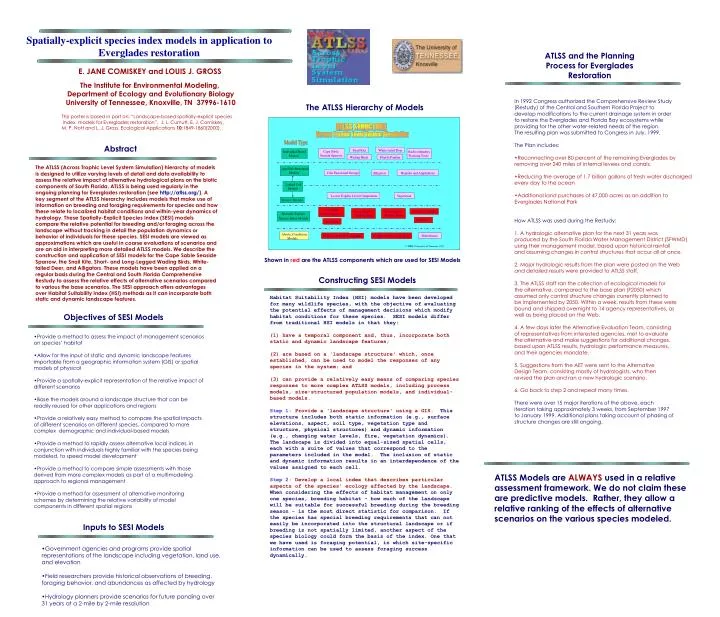
ATLSS STRUCTURE Across Trophic Level System Simulation Snail Kite Radio-telemetry Tracking Tools Model Type Wading Birds Individual-Based Models Constructing SESI Models Florida Panther ATLSS and the Planning Process for Everglades Restoration • Habitat Suitability Index (HSI) models have been developed for many wildlife species, with the objective of evaluating the potential effects of management decisions which modify habitat conditions for these species. SESI models differ from traditional HSI models in that they: • (1) have a temporal component and, thus, incorporate both static and dynamic landscape features; • (2) are based on a 'landscape structure' which, once established, can be used to model the responses of any species in the system; and • (3) can provide a relatively easy means of comparing species responses to more complex ATLSS models, including process models, size-structured population models, and individual-based models. • Step 1:Provide a 'landscape structure' using a GIS. This structure includes both static information (e.g., surface elevations, aspect, soil type, vegetation type and structure, physical structures) and dynamic information (e.g., changing water levels, fire, vegetation dynamics). The landscape is divided into equal-sized spatial cells, each with a suite of values that correspond to the parameters included in the model. The inclusion of static and dynamic information results in an interdependence of the values assigned to each cell. • Step 2:Develop a local index that describes particular aspects of the species' ecology affected by the landscape. When considering the effects of habitat management on only one species, breeding habitat - how much of the landscape will be suitable for successful breeding during the breeding season - is the most direct statistic for comparison. If the species has special breeding requirements that can not easily be incorporated into the structural landscape or if breeding is not spatially limited, another aspect of the species biology could form the basis of the index. One that we have used is foraging potential, in which site-specific information can be used to assess foraging success dynamically. Age/Size Structured Models Alligators Fish Functional Groups Reptiles and Amphibians Inputs to SESI Models Abstract Abiotic Conditions Models • The ATLSS (Across Trophic Level System Simulation) hierarchy of models is designed to utilize varying levels of detail and data availability to assess the relative impact of alternative hydrological plans on the biotic components of South Florida. ATLSS is being used regularly in the ongoing planning for Everglades restoration (see http://atlss.org/). A key segment of the ATLSS hierarchy includes models that make use of information on breeding and foraging requirements for species and how these relate to localized habitat conditions and within-year dynamics of hydrology. These Spatially-Explicit Species Index (SESI) models compare the relative potential for breeding and/or foraging across the landscape without tracking in detail the population dynamics or behavior of individuals for these species. SESI models are viewed as approximations which are useful in coarse evaluations of scenarios and are an aid in interpreting more detailed ATLSS models. We describe the construction and application of SESI models for the Cape Sable Seaside Sparrow, the Snail Kite, Short- and Long-Legged Wading Birds, White-tailed Deer, and Alligators. These models have been applied on a regular basis during the Central and South Florida Comprehensive Restudy to assess the relative effects of alternative scenarios compared to various the base scenarios. The SESI approach offers advantages over Habitat Suitability Index (HSI) methods as it can incorporate both static and dynamic landscape features. Linked Cell Models Lower Trophic Level Components Vegetation Process Models • In 1992 Congress authorized the Comprehensive Review Study • (Restudy) of the Central and Southern Florida Project to • develop modifications to the current drainage system in order • to restore the Everglades and Florida Bay ecosystems while • providing for the other water-related needs of the region. • The resulting plan was submitted to Congress in July, 1999. • The Plan includes: • Reconnecting over 80 percent of the remaining Everglades by removing over 240 miles of internal levees and canals. • Reducing the average of 1.7 billion gallons of fresh water discharged every day to the ocean • Additional land purchases of 47,000 acres as an addition to Everglades National Park • How ATLSS was used during the Restudy: • 1. A hydrologic alternative plan for the next 31 years was • produced by the South Florida Water Management District (SFWMD) • using their management model, based upon historical rainfall • and assuming changes in control structures that occur all at once. • 2. Major hydrologic results from the plan were posted on the Web • and detailed results were provided to ATLSS staff. • 3. The ATLSS staff ran the collection of ecological models for • the alternative, compared to the base plan (F2050) which • assumed only control structure changes currently planned to • be implemented by 2050. Within a week, results from these were • bound and shipped overnight to 14 agency representatives, as • well as being placed on the Web. • 4. A few days later the Alternative Evaluation Team, consisting • of representatives from interested agencies, met to evaluate • the alternative and make suggestions for additional changes, • based upon ATLSS results, hydrologic performance measures, • and their agencies mandate. • 5. Suggestions from the AET were sent to the Alternative • Design Team, consisting mostly of hydrologists, who then • revised the plan and ran a new hydrologic scenario. • 6. Go back to step 2 and repeat many times. • There were over 15 major iterations of the above, each • iteration taking approximately 3 weeks, from September 1997 • to January 1999. Additional plans taking account of phasing of • structure changes are still ongoing. Cape Sable Seaside Sparrow Cape Sable Seaside Sparrow Spatially-Explicit Species Index Models White-tailed Deer White-tailed Deer Long-legged Wading Birds Short-legged Wading Birds Snail Kite Alligators High Resolution Hydrology Disturbance High Resolution Topography © TIEM / University of Tennessee 1999 • Government agencies and programs provide spatial representations of the landscape including vegetation, land use, and elevation • Field researchers provide historical observations of breeding, foraging behavior, and abundances as affected by hydrology • Hydrology planners provide scenarios for future ponding over 31 years at a 2-mile by 2-mile resolution ATLSS Models are ALWAYS used in a relative assessment framework. We do not claim these are predictive models. Rather, they allow a relative ranking of the effects of alternative scenarios on the various species modeled. Spatially-explicit species index models in application to Everglades restoration E. JANE COMISKEY and LOUIS J. GROSS The Institute for Environmental Modeling, Department of Ecology and Evolutionary Biology University of Tennessee, Knoxville, TN 37996-1610 The ATLSS Hierarchy of Models This poster is based in part on: “Landscape-based spatially-explicit species index models for Everglades restoration”, J. L. Curnutt, E. J. Comiskey, M. P. Nott and L. J. Gross. Ecological Applications 10:1849-1860(2000). Shown in red are the ATLSS components which are used for SESI Models Objectives of SESI Models • Provide a method to assess the impact of management scenarios on species’ habitat • Allow for the input of static and dynamic landscape features importable from a geographic information system (GIS) or spatial models of physical • Provide a spatially-explicit representation of the relative impact of different scenarios • Base the models around a landscape structure that can be readily reused for other applications and regions • Provide a relatively easy method to compare the spatial impacts of different scenarios on different species, compared to more complex demographic and individual-based models • Provide a method to rapidly assess alternative local indices, in conjunction with individuals highly familiar with the species being modeled, to speed model development • Provide a method to compare simple assessments with those derived from more complex models as part of a multimodeling approach to regional management • Provide a method for assessment of alternative monitoring schemes by determining the relative variability of model components in different spatial regions
SESI Output Comparison Maps: Providing decision makers with information as to the relative impact of hydrology scenarios upon selected species. Cape Sable Seaside Sparrow Breeding Potential Snail Kite Index Display two hydrology scenarios (left and right maps) and their differences (middle map). Difference map uses colors color-blind individuals can interpret Data are mapped into twenty classes. Presented maps all contain the mean of 30 years data. Short Legged Wading Bird Foraging Condition Long Legged Wading Bird Foraging Condition Used to compare two hydrology scenarios. Presents large data sets in an easy to understand format. American Alligator Breeding Potential White-tailed Deer Breeding Potential Indicate general spatial and temporal trends Permits the knowledge codified within models to be easily communicated to management. Everglades SESI Models • Cape Sable Seaside Sparrow SESI Model • Focuses on breeding rules, all based on the results of intensive field studies. Rules describe how the dynamics of hydrology affect the duration and spatial extent of the annual dry season during which the water level in any cell remains below the nesting threshold level. Then estimates are made of the potential number of breeding cycles in cells with appropriate levels of preferred habitat. • Snail Kite Model • Estimates appropriate foraging conditions during the kite breeding season for these raptors which are obligate predators of the apple snail. The requirements for appropriate foraging sites include: • having the potential for a substantial population of apple snails • having surface water present • having surface water depths less than certain depths (or else the kites cannot locate and catch snails). • Wading Bird Foraging Conditions Index Model • Computes a Foraging Conditions Index (FCI) based on how hydrologic factors affect the concentration and availability of food resources during the breeding season. The FCI is a composite index of spatial and temporal patterns. It calculates the FCI for two different types of wading birds: • a "long-legged forager" type with a feeding depth range of 5-35 cm and a long nesting cycle (during which a major water level reversal would cause nesting failure and decrease the index value to zero); • a "short-legged forager" type with a feeding depth range of 0-20 cm and a shorter nesting cycle (with potentially multiple opportunities for nesting during a single dry season). • White-tailed Deer Model • Computes how hydrologic factors affect the production and availability of food resources and the availability of dry bedding sites during the breeding season. Some References on ATLSS ATLSS Home Page http://atlss.org/ Curnutt, J. L., E. J. Comiskey, M. P. Nott and L. J. Gross. 2000. Landscape-based spatially-explicit species index models for Everglades restoration. Ecological Applications 10:1849-1860. DeAngelis, D. L., L. J. Gross, M. A. Huston, W. F. Wolff, D. M. Fleming, E. J. Comiskey, S. M. Sylvester. 1998. Landscape Modeling for Everglades Ecosystem Restoration. Ecosystems 1:64-75. DeAngelis, D. L., L. J. Gross, W. F. Wolff, D. M. Fleming, M. P. Nott and E. J. Comiskey. 2000. Individual-based models on the landscape: applications to the Everglades. P. 199-211 in J. Sanderson and L. D. Harris (eds.), Landscape Ecology: A Top-Down Approach. Lewis Publishers, Boca Raton, FL. Duke-Sylvester, S. and L. J. Gross. 2000. Integrating spatial data into an agent-based modeling system: ideas and lessons from the development of the Across Trophic Level System Simulation (ATLSS). To appear in: Agent-based models and GIS, R. Gimblett (ed.), Oxford University Press. Gaff, H., D. L. DeAngelis, L. J. Gross, R. Salinas and M. Shorrosh. 2000. A dynamic landscape model for fish in the Everglades and its application to restoration. Ecological Modelling 127:33-52.