Download
1 / 18
180 likes | 330 Vues
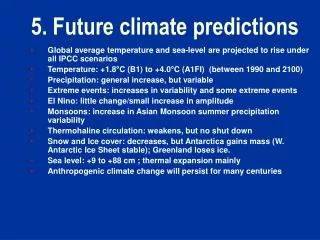
11 th Annual CMAS Conference 15-17 th October, 2012. Improvement of extreme climate predictions from dynamical climate downscaling. Yang Gao 1 , Joshua S. Fu 1 , John B. Drake 1 , Yang Liu 2 , Jean-Francois Lamarque 3 , Kan Huang 1 , Xinyi Dong 1 and David Wong 4

E N D
11th Annual CMAS Conference 15-17th October, 2012 Improvement of extreme climate predictions from dynamical climate downscaling Yang Gao1, Joshua S. Fu1, John B. Drake1, Yang Liu2, Jean-Francois Lamarque3, Kan Huang1, Xinyi Dong1 and David Wong4 1Department of Civil and Environmental Engineering, The University of Tennessee, Knoxville, TN 2Rollins School of Public Health, Emory University, Atlanta, Georgia 3Atmospheric Chemistry and Climate and Global Dynamics Divisions, National Center for Atmospheric Research, Boulder, CO 4Atmospheric Modeling and Analysis Division, NERL, USEPA, Research Triangle Park, NC
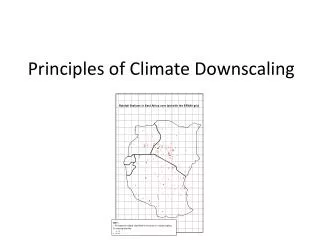
Linkage from Global model to Regional Model 2 Community Atmosphere Model (CAM) Community Land Model (CLM) Community Sea Ice Model (CSIM) Ocean component (POP) Regional Climate/Chem Model WRF 3.2.1/CMAQ 5.0 Community Earth System Model CESM 1.0 2001-2004/2057-2059 D1/D2/D3: 36-12-4 km The points represent NCDC US COOP network station observation points in three regions: Northeast (red color), Midwest (blue color) and Southeast (green color). 1850-2100 http://dss.ucar.edu (dataset number ds510.6)
3 Global Climate Simulation Scenarios RCP 8.5 RCP 4.5 RCP:20052100 • Representative Concentration Pathways (RCP) 4.5 • Low-medium emissions increasing scenario • Representative Concentration Pathways (RCP) 8.5 • Fossil fuel intensive scenario Source: http://stratus.astr.ucl.ac.be/textbook/pdf/Chapter_6.pdf
4 Three Hourly Global Climate Simulations • Three hourly simulations were conducted for RCP 4.5 and RCP 8.5 • The data has been published in the Earth System Grid and is available to use by the climate community http://esg2-gw.ccs.ornl.gov
5 The Definitions of Heat Waves • Heat wave intensity: The highest three continuous night minimum temperatures in a certain year • Heat wave duration and frequency: Two maximum daily temperature thresholds are used for the determination: T1 and T2 can be • a) fixed values 30º and 25 ºC • b) the 97.5th and 81st percentiles • A heat wave period is: • (1) the maximum daily temperature reached T1 for at least 3 days • (2) the mean daily maximum temperature remained above T1 while the daily maximum temperature reached T2 each day Source: CCSP, 2008
6 Evaluation of daily maximum temperature (T1/T2) • 19 states in WRF and 17 states in CESM have bias less than 2 ºC. • In WRF, more than half of the states (13 out of 23) shows bias less than 1 ºC 97.5% 81% WRF-NCDC CESM-NCDC Gao et al., submitted to ERL
7 Evaluation of Heat Waves in CESM and WRF Intensity Duration Frequency 25 68 62 91 54 69 13 43 46 28 98 97
8 Wide Increase in Heat Wave Intensity, Duration and Frequency Present RCP8.5 RCP8.5-Present Heat wave intensity (ºC) Heat wave duration (days/event) Heat wave frequency (events/year)
9 State-Level Increase in Heat Wave Intensity, Duration and Frequency Intensity Duration Frequency 3.05 1.92 5.79 × 11 5 2.78 1.78 × 4.34 5 8 2.46 1.23 3.77 × 6 5
10 City-Level Increase in Heat Wave Intensity, Duration and Frequency Among the top 50 cities by population in US, 20 is located in the eastern US http://en.wikipedia.org/wiki/List_of_United_States_cities_by_population
11 City-Level Increase in Heat Wave Intensity, Duration and Frequency
12 Extreme precipitation A rainy day is defined as a day when the daily precipitation totals at least 1 mm. In the current analysis, extreme precipitation is defined as the 95th percentile of all the rainy days • Total extreme precipitation (mm/year): Annual total of • extreme daily precipitation amounts • Annual extreme events (days/year): Number of extreme • daily precipitation events • Daily extreme precipitation (mm/day): Annual mean rate of • extreme daily precipitation, which is calculated as the total • amount of annual extreme precipitation divided by total • annual extreme precipitation days.
13 Evaluation of precipitation
14 Extreme precipitation Present RCP8.5 RCP8.5-Present Total extreme precipitation Annual extreme events Daily extreme precipitation
15 Maximum Daily 8-hr Ozone (MDA8)
16 Summary • Dynamical climate downscaling technique has been applied to CESM, and the downscaled results show significant improvement over global outputs, primarily due to the incorporation of local detailed topography and land use information • In future climate, more intense and frequency heat waves and extreme precipitation were projected • In RCP 4.5, ozone concentrations show significant decrease by the end of 2050s; In RCP 8.5, ozone concentration could increase from combined climate and emission effects
18 Acknowledgement This research was supported in part by the National Science Foundation through TeraGrid resources provided by National Institute for Computational Sciences (NICS) under grant number [TG-ATM110009]. This research also used resources of the Oak Ridge Leadership Computing Facility at the Oak Ridge National Laboratory, which is supported by the Office of Science of the U.S. Department of Energy under Contract No. DE-AC05-00OR22725. This work was partially sponsored by the Centers for Disease Control and Prevention (CDC) under a research project cooperative agreement (5 U01 EH000405).
19 Thanks for your attention! Questions?