Download
1 / 25
250 likes | 457 Vues
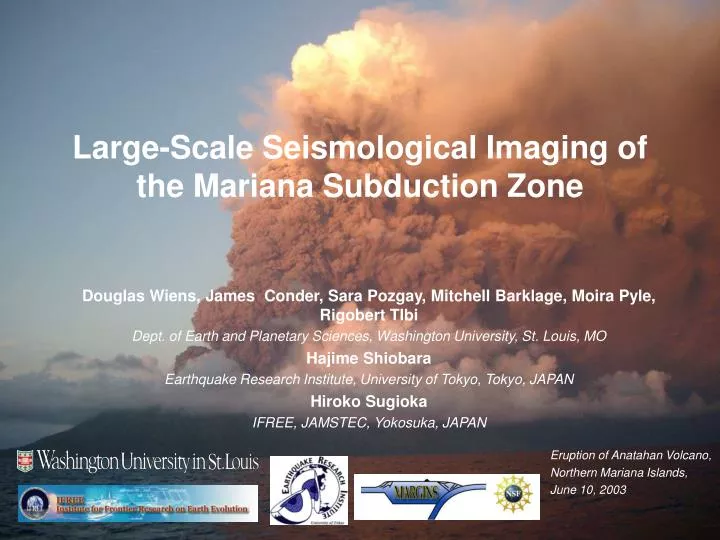
Large-Scale Seismological Imaging of the Mariana Subduction Zone. Douglas Wiens, James Conder, Sara Pozgay, Mitchell Barklage, Moira Pyle, Rigobert TIbi Dept. of Earth and Planetary Sciences, Washington University, St. Louis, MO Hajime Shiobara

E N D
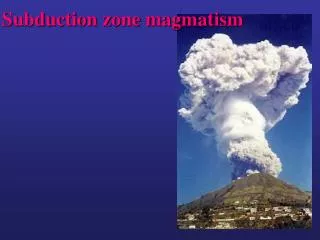
Large-Scale Seismological Imaging of the Mariana Subduction Zone Douglas Wiens, James Conder, Sara Pozgay, Mitchell Barklage, Moira Pyle, Rigobert TIbi Dept. of Earth and Planetary Sciences, Washington University, St. Louis, MO Hajime Shiobara Earthquake Research Institute, University of Tokyo, Tokyo, JAPAN Hiroko Sugioka IFREE,JAMSTEC, Yokosuka, JAPAN Eruption of Anatahan Volcano, Northern Mariana Islands, June 10, 2003
Outline Passive Ocean Bottom Seismograph Deployments in the Mariana Arc Seismic Anisotropy - constraints on mantle flow Interpreting seismic velocity and attenuation Seismic velocity and attenuation tomography results Implications of results for - forearc - arc --- backarc spreading center
Mariana Passive Ocean Bottom Seismograph Deployments 2003-2004 Mariana • 2001-2002 ERI deployment 9 OBSs • 2003-2004 Joint US-Japan deployment - 50 US OBS (LDEO) - 8 Japanese OBS (ERI) - 20 broadband land stations - deployed from R/V Kaiyo - recovered with R/V Wecoma - problems with 35 LDEO OBSs
Results from initial 2001-2002 9 OBS deployment: Intermediate Depth Double Seismic Zone Shiobara et al., in prep.
P and S velocity tomography from initial 9 OBS deployment Shiobara et al., in prep.
Mantle flow, seismic anisotropy, and lattice preferred orientation Shear velocity of olivine Relationship of anisotropy and strain Mainprice & Silver [1993] Data from Kumazawa & Anderson [1969]
Rose Diagrams - plotted at station for sources in upper 250 km Spatial Averaging - for paths in the upper 250 km Mariana Arc Shear Wave Splitting Pozgay et al. [2007]
Anisotropy and Structure from Rayleigh Waves Moira Pyle, see poster • Rayleigh waves show low velocities in the arc and backarc spreading center • Average fast direction is EW • We suggest that portions of the forearc and backarc with EW fast directions dominate
Modeling (Kneller et al, 2005) 3 types of fabric (Jung and Karato, 2001) Interpretation of anisotropy in arcs… along-strike flow or effect of water? • Modeling shows that conditions favorable to type-b fabric (low T, high stress) occur in the forearc • Yet observations from several arcs show that along-strike fast directions extend well into the backarc • This suggests that along-strike fast directions result from mantle flow
How do material properties affect mantle seismic observables? Temperature effect on seismic velocity and attenuation -- no melt • P and S velocities are controlled by anharmonic temperature derivatives at temperatures below about 900 C --- relatively linear VP/T ~ 0.6 m/s/K ( 0.8 % per 100C); VS/T ~ 0.45 m/s/K (1 % per 100C) • Above 900 C attenuation increases rapidly and the velocity derivatives are non-linear • Both attenuation and velocity are also a function of frequency, grain size, and depth (Jackson et al., 2002; Faul and Jackson, 2005) Shear Velocity Velocity derivative
Melt and Water Geometry • The effect of fliuds on seismic velocity is a function of the fluid geometry • There is still a controversy about melt geometry and how it varies with percent melt • Melt geometry is also related to porosity and permeability and how fast melt escapes q 60 q < 60 Node q q Tubule Wark et al.,2003
The seismic effect of partial melt as a function of inclusion aspect ratio S velocity derivative wrt melt fraction Fractional change in Vs relative to fractional change in Vp is ratio of solid bulk modulus to liquid bulk modulus After Takei [2002]
Shear Velocity Reduction and Attenuation for Olivine containing Melt Modulus Reduction and Attenuation Mechanism Melt and seismic attenuation • Line thickness gives melt content; line color gives grain size • For a given grainsize, 1% melt gives nearly an order of magnitude increase at 1 Hz • Seismic velocity reduction occurs through both “melt squirt” and grain boundary sliding Faul et al., 2004
Effect of dissolved water? Karato, 2003 • Experiments: Aizawa et al [submitted] shows effects but no quantitative relationship • Karato [2003] extrapolates from the rheological effect • 810 ppm H/Si = .005 wt % water - normal MORB • Mariana backarc - .01 to 0.25 wt % H2O in the mantle source [Kelley et al., 2006] • At 100 km depth water < 0.01 to 0.02 wt % [Hirschmann, 2006] • Lowers Qs from 80 to 60; 2% decrease in seismic velocity
P velocity S velocity Velocity Tomography Depth (km) Barklage et al, in prep. • Preliminary tomography results using 3-D double difference tomography • Show low velocity region beneath the arc at depths of 30-100 km • Separate low velocity region beneath backarc spreading center • Backarc poorly resolved due to high attenuation, OBS failures • Low velocities in shallow slab and outer forearc • Improvements will add teleseismic arrivals; incorporate crustal thickness variations
P and S wave attenuation tomography • 2-D attenuation tomography along the line of OBSs • Frequency 0.05-10 Hz; Assumes = 0.27 • ~ 2300 P wave t* measurements, ~ 440 S wave; P resolution better than S • Highest attenuation in sheet-like anomaly beneath the spreading center • High attenuation beneath arc, in shallow slab and outer forearc Pozgay et al, in prep, see poster
P velocity and attenuation - forearc 0 100 200 • Most forearcs show high mantle seismic velocity and low attenuation - “cold nose” • Mariana forearc shows regions of low velocity and high attenuation trenchward of the arc outer forearc and shallow slab • Low seismic velocity may indicate serpentinization • Effect of serpentinization on attenuation is unknown; high attenuation may result from fluids
Receiver function evidence for widespread serpentinization in the forearc Tibi et al. submitted; see poster Widespread low velocity body ~ 40-50 km depth above the slab in the forearc
P velocity and attenuation tomography - arc and backarc • Slow velocity high attenuation beneath the arc at 30-100 km depth • Sheet-like high attenuation anomaly beneath spreading center 75 km wide, extends to 100 km depth • Arc and spreading center anomalies separated at shallow depths in both images
Thermal Model (J. Conder) P Attenuation Modeling(assume all anomalies due to temperature) Modeled Attenuation (using Faul & Jackson 2005) P Attenuation (Pozgay in prep) • Assume thermal model and use Q-temperature relationships to predict attenuation • Observed attenuation is similar except in high attenuation regions (note scale) • Spreading center and arc have much higher attenuation than model • We interpret as effect of in-situ melt; cannot quantitatively estimate % melt • Narrow back-arc anomaly may suggest dynamic upwelling
Mantle temperature variations between active backarcs Seismic Structure Major Element systematics • Large solid symbols are basin averages (with error bars) • Data from Kelley et al [2005], dry (< 0.65 wt % in melt) samples only • Na2O and FeO corrected to equilibrium with Fo90 olivine • Significant variations between active backarcs – Lau slowest, and Mariana fastest • Variations largely confined to the “melt producing” region - 40 to 100 km depth Wiens, Kelley, Plank, EPSL, 2006
Attenuation structure comparison - Mariana vs Lau (Tonga) backarc spreading centers Pozgay et al, in prep. Roth et al, 1999; Reprocessed by J. Conder • Mariana image uses = 0 for direct comparison with Tonga results • Tonga image has lower spatial resolution • Tonga shows much higher attenuation, greater depth extent • Consistent with higher temperatures and greater melt productivity • Much broader anomaly - passive vs active upwelling at ridge?
Conclusions Shear wave splitting shows along-strike fast directions in the mantle wedge beneath the arc and extending to the backarc; Interpreted as along-strike mantle flow in the low-viscosity part of the wedge Low velocity and high attenuation regions exist in the forearc, perhaps due to serpentinization and fluids Low velocity and high attenuation extends from 30-100 km depth beneath the arc, likely defining the melt production region Arc and backarc spreading center anomalies are separated at depths < 80 km A 75 km wide sheet-like high attenuation anomaly extends to 100 km depth beneath the backarc spreading center We interpret this as evidence of focused dynamic upwelling The seismic data provide evidence of in-situ melt in the upper mantle but cannot yet estimate melt %