Download
1 / 13
140 likes | 562 Vues
Infographics. Noun: A visual representation of information, data, or knowledge. http://econsultancy.com/us/blog/10726-why-do-infographics-make-great-marketing-tools-infographic. http://www.infographz.com/wp-content/uploads/2013/03/what-is-an-infographic.jpg.

E N D
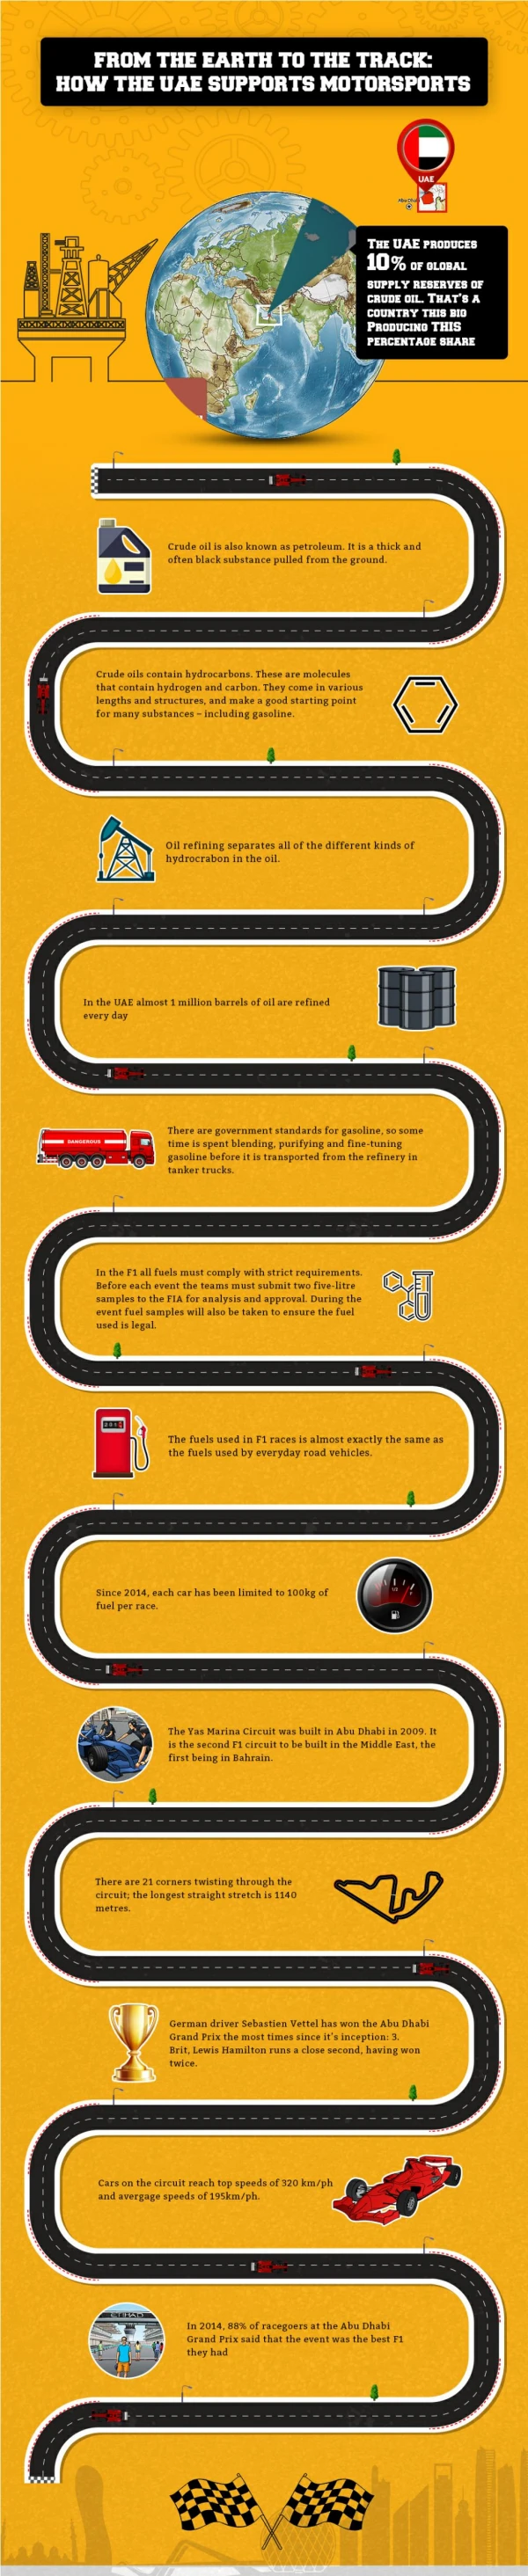
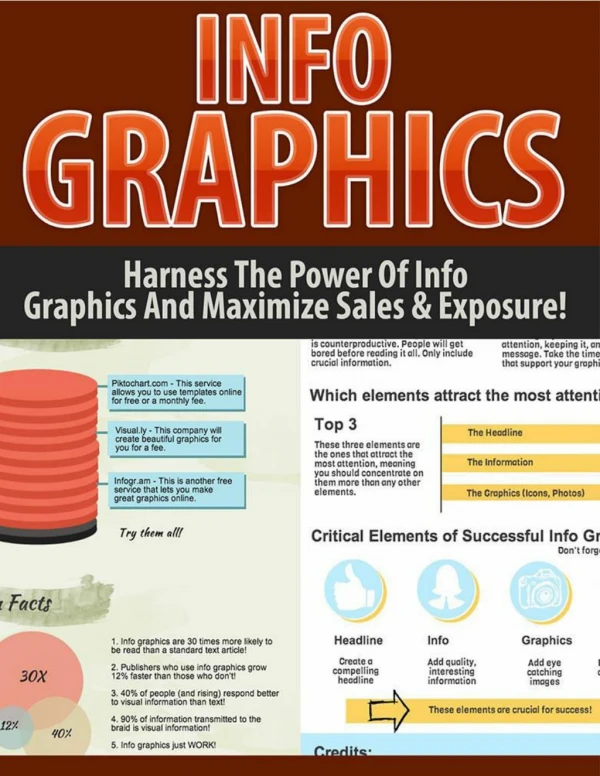
Infographics Noun: A visual representation of information, data, or knowledge.
http://econsultancy.com/us/blog/10726-why-do-infographics-make-great-marketing-tools-infographichttp://econsultancy.com/us/blog/10726-why-do-infographics-make-great-marketing-tools-infographic
http://www.infographz.com/wp-content/uploads/2013/03/what-is-an-infographic.jpghttp://www.infographz.com/wp-content/uploads/2013/03/what-is-an-infographic.jpg
TED is a nonprofit devoted to Ideas Worth Spreading. It started out (in 1984) as a conference bringing together people from three worlds: Technology, Entertainment, Design. “We believe passionately in the power of ideas to change attitudes, lives and ultimately, the world. So we're building here a clearinghouse that offers free knowledge and inspiration from the world's most inspired thinkers…” http://www.ted.com/talks/david_mccandless_the_beauty_of_data_visualization.html
http://www.stopbullyingnowfoundation.org/main/images/stories/bullying-infographic.pnghttp://www.stopbullyingnowfoundation.org/main/images/stories/bullying-infographic.png
http://www.trade-schools.net/graphics/infographic-earning-potential-tradeschools.gifhttp://www.trade-schools.net/graphics/infographic-earning-potential-tradeschools.gif
http://awesome.good.is.s3.amazonaws.com/transparency/web/1107/space-invaders/transparency.jpghttp://awesome.good.is.s3.amazonaws.com/transparency/web/1107/space-invaders/transparency.jpg
http://24.media.tumblr.com/IwM8PIQ02jtoio9fQMkOLehto1_r1_500.jpghttp://24.media.tumblr.com/IwM8PIQ02jtoio9fQMkOLehto1_r1_500.jpg
Create your own Infographic: Examine your data to look for patterns and understandings. Determine your thesis statement. Select data to support your thesis. Decide on visuals/charts/themes and create a draft. Use Power Point slide to create your Infographic and save as a jPeg.
Meat ConsumptionCausesHarm to thePlanet It takes 10lbs of plants to produce 1 lb of beef. Grain used to feed livestock in the US could feed 800 million people. Environmental damage done from grazing livestock has been a factor leading to over 171 species of animals being classified as endangered. It takes 2,500 gallons of water to produce 1 lb of beef. Grazing livestock has damaged 80% of streams in the Western US. Data adapted from information at http://vegetarian.procon.org/