Download
1 / 11
140 likes | 575 Vues
Infographics. “A Picture is worth a thousand words”. http://www.learningliftoff.com/infographics-education/#.U3kFVfldV1Y. http://www.edudemic.com/wp-content/uploads/2013/06/202x194xgood-infographic.png.pagespeed.ic.wk8Wtb5gfr.png.

E N D
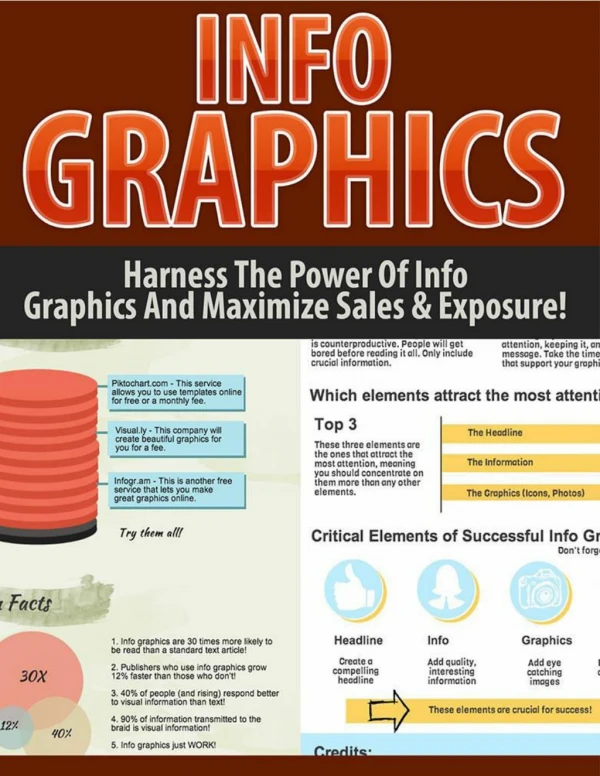
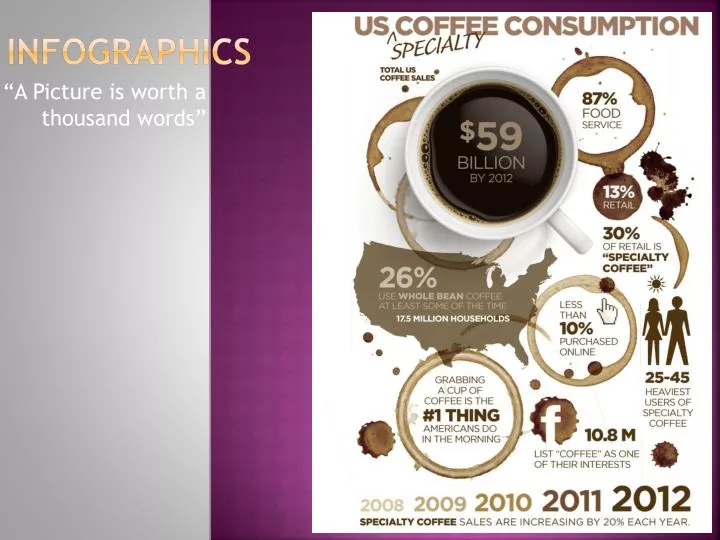
Infographics “A Picture is worth a thousand words”
http://www.learningliftoff.com/infographics-education/#.U3kFVfldV1Yhttp://www.learningliftoff.com/infographics-education/#.U3kFVfldV1Y
http://www.edudemic.com/wp-content/uploads/2013/06/202x194xgood-infographic.png.pagespeed.ic.wk8Wtb5gfr.pnghttp://www.edudemic.com/wp-content/uploads/2013/06/202x194xgood-infographic.png.pagespeed.ic.wk8Wtb5gfr.png
http://infographicality.com/timefillers/Pixar%20Movies%20Final1%2002%20Infographic.jpghttp://infographicality.com/timefillers/Pixar%20Movies%20Final1%2002%20Infographic.jpg
Questions: • What is “Attention Economy”? a. Consumer attention as a form of currency b. An intense attention to economic matters c. Effects of where consumer attention is and how it affects the economic climate 2. What percentage of neurons are dedicated to visual functions? a. 25% b. 50% c. 75% 3. On average, people read _____% of words on a webpage. a. 10% b. 50% c. 20%
Sources: • Mark Smiciklas (2012). The Power of Infographics: Using Pictures to Communicate and Connect with Your Audience. • http://spyrestudios.com/the-anatomy-of-an-infographic-5-steps-to-create-a-powerful-visual/ • http://www.ventureharbour.com/the-anatomy-of-creating-a-great-infographic/ • Khazan, Olga, “How can businesses use infographics” • http://www.learningliftoff.com/infographics-education/#.U3kFVfldV1Y • Malaria Infographic http://www.bestinfographics.co/wp-content/uploads/2013/02/information-and-facts-about-malaria-infographic.jpg • Color Emotion Guide: https://www.google.com/search?safe=off&site=&tbm=isch&source=hp&biw=1600&bih=791&q=infographic&oq=infographic&gs_l=img.3..0l10.1979.4156.0.4358.11.6.0.5.5.0.172.637.4j2.6.0....0...1ac.1.43.img..0.11.681.UG7JmVAJ2Jk#facrc=_&imgdii=_&imgrc=Bc9xihQ5k2nyFM%253A%3Bxzo03g-E_t4DvM%3Bhttp%253A%252F%252Fdailyinfographic.com%252Fwp-content%252Fuploads%252F2013%252F01%252FColor_Emotion_Guide22.png%3Bhttp%253A%252F%252Fdailyinfographic.com%252Flogos-a-look-at-the-meaning-in-colors-infographic%3B1500%3B1314