Download
1 / 28
280 likes | 475 Vues
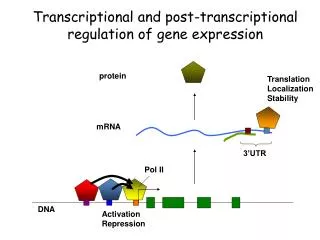
Network-based data integration reveals extensive post-transcriptional regulation of human tissue-specific metabolism Tomer Shlomi * , Moran Cabili * , Markus J. Herrgard, Bernhard Q Palsson and Eytan Ruppin * These authors contributed equally to this work. Metabolism.

E N D
Network-based data integration reveals extensive post-transcriptional regulation of human tissue-specific metabolism Tomer Shlomi*, Moran Cabili*, Markus J. Herrgard, Bernhard Q Palsson and Eytan Ruppin * These authors contributed equally to this work
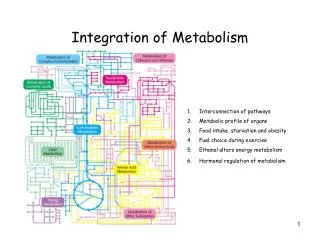
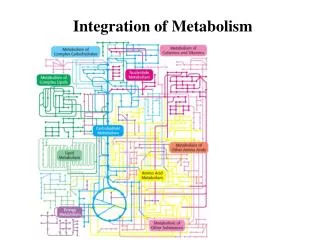
Metabolism Metabolism is the totality of all the chemical reactions that operate in a living organism. Catabolic reactions Breakdown and produce energy Anabolic reactions Use energy and build up essential cell components
Why Study Human Metabolism? • In born errors of metabolism cause acute symptoms and even death on early age • Metabolic diseases (obesity, diabetics) are major sources of morbidity and mortality. • Metabolic enzymes and their regulators gradually becoming viable drug targets
Metabolite Reaction catalyzed by an enzyme Modeling Cellular MetabolismA Short Review Metabolic flux : The production or elimination of a quantity of metabolite per mass of organ or organism over a specific time frame “..it is the concept of metabolic flux that is crucial in the translation of genotype and environmental factors into phenotype or a threshold for disease.” Brendan Lee Nature 2006
constant Constraint Based Modeling Find a steady-state flux distribution through all biochemical reactions • Under the constraints: • Mass balance: metabolite production and consumption rates are equal • Thermodynamic: irreversibility of reactions • Enzymatic capacity: bounds on enzyme rates • Successfully predicts:
Glucokinase Glucose -1 ATP -1 G-6-P +1 ADP +1 Mass balance S·v = 0 Subspace of R Thermodynamic & capacity 10 >vi > 0 Bounded convex cone Optimization Maximize Vgrowth n growth Constraint Based Modeling (CBM)Mathematical Representation of Constrains • Stoichiometric matrix – network topology with stoichiometry of biochemical reactions reactions Glucose + ATP Glucokinase Glucose-6-Phosphate + ADP metabolites Fell, et al (1986),Varma and Palsson (1993)
Human Metabolic Models • Motivated by the fact that in-vivo studies of tissue-specific metabolic functions are limited in scope • Individual genes and pathways (KEGG, HumanCyc) • Detailed description of the genes, reactions, enzymes • No connections between pathways • Specific cell-types and organelles • Red blood cell Wiback et al. 2002 • Mitochondria Vo et al. 2004 • Large-Scale Human Metabolic Networks • The first large-scale model of human metabolism ~2000 genes, ~3700 reactions, 7 organelles (Duarte et al. 2007, Ma et al. 2007)
Can we use constraint-based modeling to systematically predict tissue-specific metabolic behavior? CBM in HumanModeling human tissue function is problematic • Various cell-types activate different pathways (shown in Expression studies) • Hard to formulate cellular metabolic objectives – (like biomass maximization for microbial species) • Unknown inputs and outputs of each cell-type
Our Objective : • General approach to study tissue specific metabolic models 2. Tissue specific activity of metabolic genes/reactions Our Method : Model Integration with Tissue-Specific Gene and Protein Expression Data Motivated by the assertion that highly expressed genes in a certain tissue are likely to be active there
Our Method 1 Gene expression data Protein measurements data Gene-to-reaction mapping Highly and Lowly expressed gene sets 2 Human Metabolic Model (Duarte et. al) Highly and Lowly expressed reaction sets 3 New objective function: Maximize consistency with expression data. Use Mixed Integer Linear Programming (MILP) 4 Determine activity state and conf. level for each gene/reaction
Our Method Determine Highly and Lowly Reaction sets 1. Genes set :Extract set of enzymes whose expression is significantly increased or decreased (GeneNote, HPRD) 2. Reactions set :Employ a detailed gene-to-reaction mapping to identify a tissue-specific expression state for each reaction R1 = (g1 & g2) | g3 | g4
Our Method 1 Gene expression data Protein measurements data Gene-to-reaction mapping Highly and Lowly expressed gene sets 2 Human Metabolic Model (Duarte et. al) Highly and Lowly expressed reaction sets 3 New objective function: Maximize consistency with expression data. Use Mixed Integer Linear Programming (MILP) 4 Determine activity state and conf. level for each gene/reaction
Our Method Represent Flux Consistency with Expression State Highly expressed Output M3 M7 E2 E1 H2 Output M4 M8 H1 E3 M1 M5 Input L2 E4 L1 M2 M6 H3 M9 E6 E5 E7 Lowly expressed Looking for real flux vector V Now add additional Boolean vectors H, L s.t : Hi=1 Vi != 0 (if the enzyme associated with Vi is Highly expressed) L i=1 Vi=0 (if the enzyme associated with Vi is Lowly expressed)
Our Method Define a New Objective function Highly expressed Output M3 M7 E2 E1 H2 Output M4 M8 H1 E3 M1 M5 Input L2 E4 L1 M2 M6 H3 M9 E6 E5 E7 Lowly expressed 4 out of 5 reactions were consistent with the expression state! Use Mixed Integer Linear Programming. Define a new objective function: MAX Σ (Hi + Li ) Which practically mean maximize the number of Highly expressed reactions that are active and the number of Lowly expressedreactions that are inactive Maximize consistency with expression data
Our Method 1 Gene expression data Protein measurements data Gene-to-reaction mapping Highly and Lowly expressed gene sets 2 Human Metabolic Model (Duarte et. al) Highly and Lowly expressed reaction sets 3 New objective function: Maximize consistency with expression data. Use Mixed Integer Linear Programming (MILP) 4 Determine activity state and conf. level for each gene/reaction
Highly expressed M3 M7 E2 E1 M4 M8 E3 M1 M5 E4 M2 M6 M9 E6 E5 E7 Lowly expressed Our MethodFlux Activity State • Gene’s flux activity states-reflect the absence/existence of non-zero flux through the enzymatic reactions they encode • Comparison of the flux activity statesand theexpression state will teach us on post transcription regulation Up regulated Down regulated
Flux Activity State Consider Space of Possible Solutions • We predict for each tissue active and inactive gene and reactions sets • Since there is a space of possible solutions to the MILP problem we solve a set of MILP problems to determine the gene activity • Simulate a state where the gene is inactive • Simulate an active gene product Estimate confidence levels based on the drop in the consistency (with expression) between the 2 different solutions!
ResultsGene Tissue Specific Activity • We employed the method described above on • metabolic network model of Duarte et al. • gene and protein expression measurements from GeneNote and HPRD • 10 tissues : brain, heart, kidney, liver, lung, pancreas, prostate, spleen, skeletal muscle and thymus. • The activity state of 781 out of 1475 model genes was determined in at least one tissue
Post-transcriptional Regulation of Metabolic Genes • Post-transcriptional regulation plays a major role in shaping tissue-specific metabolic behavior: ~20% of the metabolic genes per tissue • average of 42 (3.6%) genes post-transcriptionallyup-regulated and 180 (15.4%) post-transcriptionallydown-regulated in each tissue down-regulated up-regulated
Cross Validation Test We performed a five-fold cross validation test 80% of the genes were used to constrain the model Gene activity states for a held-out set of 20% of the genes were predicted according to the expression constrains of the remaining other 80% The overlapbetween the genes predicted as active and the highly expressed genes in the held-out data was significantly high for all tissues
Large Scale ValidationLarge-Scale Mining of Tissue-Specificity Data • Tissue-specificity of genes, reactions, and metabolites is significantly correlated with all data sources • Tissue specificity of post-transcriptional up regulated elements is significantly high !!!! • Tissue specificity of post-transcriptional down regulated elements is significantly low !!!!
Tissue-Specific Metabolite Exchange with Biofluids 249 metabolites are known to be secreted or taken up by human tissues 54% of the metabolites are not associated with transporters and cannot be predicted by expression data Transport direction can not be inferred by the expression data A transporter might carry several metabolites Many of the known transporters are post-transcriptionall regulated
Metabolic Disease-Causing Genes • 162 metabolic genes are associated with a mendelian disease • Prediction accuracy: precision of 49% and a recall of 22% • There is a significant affect of post transcriptional regulation on disease-causing genes GBE1 causes the glycogen storage disease ispost-transcriptionally up-regulated in liver, heart, skeletal muscle, and brain)
SummaryMethodological Standpoint • First constraint-based modeling analysis of recently published human metabolic networks • First to account for post-transcriptional regulation within the computational framework of large-scale metabolic modeling • Integrate expression data as part of the optimization instead of imposing it as a constrain during the preprocessing step (Akesson et al. 2004)
SummaryMain Conclusions • Post transcriptional regulation plays a significant rule in shaping tissue specific metabolic behavior • The tissue specificity of many metabolic disease-causing genes goes markedly beyond that manifested in their expression level, giving rise to new predictions concerning their involvement in different tissues • Metabolites exchange with biofluids displays a large variance across tissues, composing a unique view of tissue-specific uptake and secretion of hundreds of metabolites
What’s Next? • Integrate other tissue-specificity data • Modeling of metabolic diseases • Using various data sources (known disease-causing genes, drug databases) • Predict tissue-wide metabolic symptoms • Predict metabolic response to drugs • Predict disease biomarkers that can be identified by biofluid metabolomics