Download
1 / 49
490 likes | 587 Vues
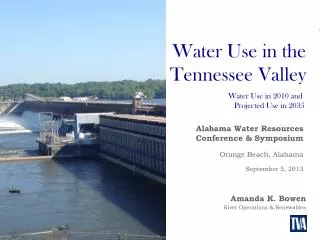
Dry Conditions in the Tennessee Valley. October 30, 2007. Chuck Bach River Operations. Outline. Recap dry conditions Explain how we operated the system in response Describe impacts on system benefits: Navigation Flood-damage reduction Power supply Water quality Water supply Recreation.

E N D
Dry Conditions in the Tennessee Valley October 30, 2007 Chuck BachRiver Operations
Outline • Recap dry conditions • Explain how we operated the system in response • Describe impacts on system benefits: • Navigation • Flood-damage reduction • Power supply • Water quality • Water supply • Recreation
Annual reservoir operating cycle January 1 Reservoirs are drawn to their lowest level to get ready for flood-producing storms. June 1 The spring fill, which typically begins in mid-March, is complete, and reservoirs are allowed to fill to their highest level. If water is limited, releases are restricted to the amount of water needed to meet reservoir-specific and system-flow requirements. Labor Day Drawdown restrictions are lifted. Water is released as needed to meet power demands and provide other benefits.
Key terms • Tributary vs. main-stem • Flood guide • System minimum operating guide (SMOG) • Balancing guide
Flood guide 4,500 4,000 3,500 3,000 Volume (1000 dsf) 2,500 2,000 Flood guide 1,500 1,000 Jan Feb Mar Apr May Jun Jul Aug Sep Oct Nov Dec
Flood guide SMOG System Minimum Operating Guide (SMOG) 4,500 4,000 3,500 3,000 Volume (1000 dsf) 2,500 2,000 1,500 1,000 Jan Feb Mar Apr May Jun Jul Aug Sep Oct Nov Dec The SMOG is based on the total volume of water in storage in 10 tributary reservoirs: Watauga, South Holston, Cherokee, Douglas, Fontana, Norris, Chatuge, Nottely, Hiwassee, and Blue Ridge.
Flood guide SMOG Balancing Guide 1 Balancing guide 1 4,500 4,000 3,500 3,000 Volume (1000 dsf) 2,500 2,000 1,500 1,000 Jan Feb Mar Apr May Jun Jul Aug Sep Oct Nov Dec
Balancing guides 2 and 3 Flood guide 4,500 SMOG Balancing guide 1 4,000 Balancing guide 2 Balancing guide 3 3,500 3,000 Volume (1000 dsf) 2,500 2,000 1,500 1,000 Jan Feb Mar Apr May Jun Jul Aug Sep Oct Nov Dec
Annual runoff variability (Eastern Valley) 60 40 20 Runoff (Percent of Normal) 0 -20 2006 -40 1985 2000 1986 1941 2007 1988 -60 2010 1900 1910 1920 1930 1940 1950 1960 1970 1980 1990 2000
Rainfall for FY2007 totaled 33.1 inches, 16.9 inches below normal (66 percent of normal). Runoff for FY07 totaled 12.5 inches, 10.4 inches below normal (54 percent of normal). 60 Normal Rainfall 50 Normal Runoff Observed Rainfall Observed Runoff 40 Inches 30 20 10 Oct Nov Dec Jan Feb Mar Apr May Jun Jul Aug Sep FY 2007 rainfall/runoff comparison (Eastern Valley)
Flood guide 4,500 SMOG 2007 storage 4,000 Balancing guide 1 Balancing guide 2 3,500 Balancing guide 3 3,000 Volume (1000 dsf) 2,500 2,000 1,500 1,000 Jan Feb Mar Apr May Jun Jul Aug Sep Oct Nov Dec Total tributary system storage, 2007
Observed average weeklyflows at ChickamaugaJune 3–September 30, 2007 Cubic feet per second Week Ending June 3 June 10 June 17 June 24 July 1 July 8 July 15 July 22 July 29 August 5 August 12 August 19 August 26 September 2 September 9 September 16 September 23 September 30 14,234 18,532 18,612 19,062 18,395 16,168 16,709 15,009 14,933 25,010 25,001 25,008 25,298 25,025 10,987 8,340 8,751 10,288
Mid-September elevations, 2001-2007: Nottely 1774 1771.6 1772 1770 1770.9 1768 1768.9 1766 1764 1764.4 Nottely Reservoir Elevation (feet) 1762 1760 1758 1758.5 1757.9 1756 1753.2 1754 1752 1750 2001 2002 2003 2004 2005 2006 2007
Mid-September elevations, 2001-2007: Fontana 1708 1704 1698.0 1700 1696 1692 1688.4 1688 1688.8 1684 1680 1680.8 1676 Fontana Reservoir Elevation (feet) 1677.0 1672 1668 1664 1666.3 1660 1656 1652 1648 1644 1646.7 1640 2001 2002 2003 2004 2005 2006 2007
Mid-September elevations, 2001-2007: Douglas 1000 996.56 996 992 988 984 978.65 980 976.87 976 972 974.58 973.84 Douglas Reservoir Elevation (feet) 968 969.19 964 960 956 955.47 952 948 944 940 2001 2002 2003 2004 2005 2006 2007
Public concerns • “Why didn’t my reservoir reach full pool this summer?” • “It rained at my house. Why didn’t the reservoir level go up?” • “Why is my reservoir lower than the other reservoirs in my area?”
Drought impacts • Navigation • Flood-damage reduction • Power supply • Water quality • Water supply • Recreation
NOAA three-month outlook Temperatures Precipitation
Reservoir operating strategy Dry conditions continue: • Maintain minimum flows; conserve any additional water • Balance tributary reservoir levels Rain returns: • Bring tributary reservoirs up to flood-guide levels • Balance tributary reservoir levels
Spreading the Message • Conservation operations since February • Exceptional drought • Minimum flow requirements continue • Hold rain/runoff as available • Beware the reservoir comparison!
Kentucky minimum flow requirements,October 1–September 30 • 5000 cfs year round (instantaneous) • 12000 cfs October 1–April 30 (daily) • 15000 cfs May 1–May 31 (bi-weekly) • 18000 cfs June 1–August 31 (bi-weekly) • 15000 cfs September 1–September 30 (bi-weekly) Note: Bi-weekly is defined as any 14-day rolling period.
Tributary reservoir elevations (feet) September 1 Elevation Flood Guide Balancing Ratio Reservoir Departure Blue Ridge 1665.9 1682.0 -16.1 0.40 Chatuge 1915.7 1923.3 -7.6 0.38 Cherokee 1041.7 1069.0 -27.3 0.35 Douglas 958.3 991.5 -32.2 0.36 Fontana 1649.5 1701.6 -52.1 0.36 Hiwassee 1479.5 1512.6 -33.1 0.37 Norris 994.3 1020.0 -25.7 0.39 Nottely 1753.1 1771.8 -18.7 0.41 South Holston 1705.2 1729.0 -23.8 0.39 Watauga 1944.4 1959.0 -14.6 0.39
Historical comparison (feet) Current Winter Target Level Pre-ROS Average Winter Level September 3 Elevation Reservoir Blue Ridge 1665.9 1668 1655 Chatuge 1915.7 1918 1914 Cherokee 1041.7 1045 1032 Douglas 958.3 954 945 Fontana 1649.5 1653 1630 Hiwassee 1479.5 1485 1472 Norris 994.3 1000 985 Nottely 1753.1 1762 1748 South Holston 1705.2 1708 1695 Watauga 1944.4 1952 1932
Monthly runoff above Chattanooga Normal runoff 2007 runoff Oct Nov Dec Jan Feb Mar Apr May Jun Jul Aug Sep
2000 1800 Actual 1600 Budgeted Latest Forecast 1400 1200 GWH 1000 800 600 400 200 Oct Nov Dec Jan Feb Mar Apr May Jun Jul Aug Sep Monthly hydro generation, FY 2007
Mid-September elevations, 2001-2007: Norris 1016 1012.9 1014 1012 1010 1009.0 1009.0 1007.4 1007.4 1008 1006 1004 Norris Reservoir Elevation (feet) 1002 1000 998 997.1 996 994 992 992.4 990 2001 2002 2003 2004 2005 2006 2007
Mid-September elevations, 2001-2007: Cherokee 1066 1064.4 1064 1062 1059.5 1060 1057.5 1058 1055.7 1056 1054 1054.7 1052 Cherokee Reservoir Elevation (feet) 1050 1048 1046 1046.8 1044 1042 1042.0 1040 1038 2001 2002 2003 2004 2005 2006 2007
Mid-September elevations, 2001-2007: Hiwassee 1520 1516 1511.7 1512 1507.5 1507.1 1508 1505.1 1506.7 1504 1503.9 1500 Hiwassee Reservoir Elevation (feet) 1496 1492 1488 1484 1480 1479.0 1476 2001 2002 2003 2004 2005 2006 2007
Mid-September elevations, 2001-2007: Watauga 1964 1962 1960.6 1960 1958 1956 1954 1952.6 1952 Watauga Reservoir Elevation (feet) 1950.5 1950 1950.2 1948 1945.1 1946 1944 1944.0 1942 1942.4 1940 2001 2002 2003 2004 2005 2006 2007
Mid-September elevations, 2001-2007: South Holston 1726 1722.7 1722 1720.4 1717.7 1719.5 1718 1716.4 1714 1710 South Holston Reservoir Elevation (feet) 1708.8 1706 1702 1699.5 1698 1694 2001 2002 2003 2004 2005 2006 2007
Mid-September elevations, 2001-2007: Chatuge 1930 1928 1926 1924.5 1924 1921.8 1922 1921.0 1920.7 1920 Chatuge Reservoir Elevation (feet) 1918.1 1918 1916.8 1916 1915.1 1914 1912 1910 2001 2002 2003 2004 2005 2006 2007
Mid-September elevations, 2001-2007: Blue Ridge 1690 1686 1682.5 1682 1678 1675.9 1675.2 1674 1671.2 1671.0 1670 Blue Ridge Reservoir Elevation (feet) 1666 1664.4 1662 1658 1654 1653.0 1650 2001 2002 2003 2004 2005 2006 2007