Download
1 / 31
350 likes | 946 Vues
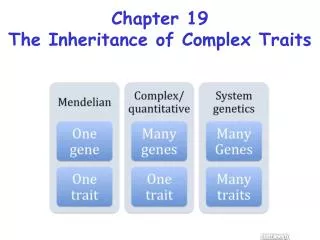
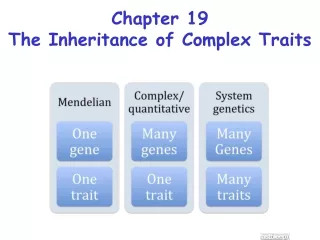
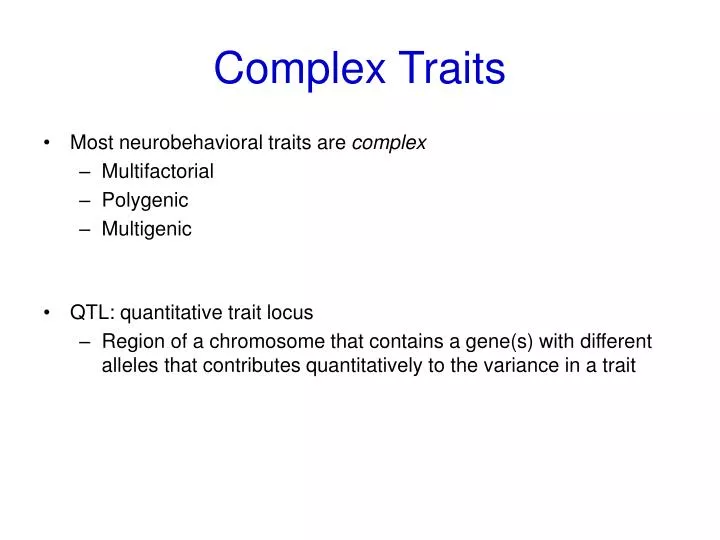
Complex Traits. Most neurobehavioral traits are complex Multifactorial Polygenic Multigenic QTL: quantitative trait locus Region of a chromosome that contains a gene(s) with different alleles that contributes quantitatively to the variance in a trait.

E N D
Complex Traits • Most neurobehavioral traits are complex • Multifactorial • Polygenic • Multigenic • QTL: quantitative trait locus • Region of a chromosome that contains a gene(s) with different alleles that contributes quantitatively to the variance in a trait
Quantitative Trait Loci (QTL):the specific loci whose allelic differences are responsible for the genetic variation in a quantitative trait (e.g. total sleep time)Note: QTL does not refer to the sum total of all loci that influence a particular trait, only those loci that are functionally polymorphic (with respect to the trait of interest) between the parental strains. Mutagenesis and engineered KOs can artificially alter any gene, however, polymorphisms can represent more subtle “natural” variations.
QTL Mapping • QTL mapping: identification of chromosomal regions containing gene(s) that correlate with measured phenotypes • Different methods • Single-marker analysis: compares phenotypic means of different marker genotypes • Interval mapping: estimates position of QTL between two markers using maximum likelihood • Composite Interval mapping: IM and multiple regression • Multiple QTL models • QTL present when LOD score exceeds critical threshold • LOD = Log of the Odds = log10 (H1/H0) • often for single locus analysis, 3.0 is significant and 2.0 is suggestive depending on sample size, number of markers, and other variables.
Generating the Backcross Cast/EiJ x C57BL/6J F1 x Cast/EiJ BC1s Backcross progeny have on average: 75% CE, 25% B6 alleles50% C/C, 50% C/B genotypes for all loci C57BL/6J (B6) Cast/EiJ (CE)
Some types of detectable variation • RFLPs (Restriction fragment length polymorphisms) • VNTRs (Variable nucleotide tandem repeats) = minisatellites • Microsatellites • SNPs (Single nucleotide polymorphisms)
Genotyping • Extract DNA from brain, liver or tail • Genotype mice using markers distributed throughout genome (10 cM resolution) • Use microsatellite repeats CACACACACACACACAC CEGTGTGTGTGTGTGTGTG CACACACACACACACACACACACACACACA B6GTGTGTGTGTGTGTGTGTGTGTGTGTGTGT • Using primers flanking the repeat region gives PCR products of different size
Genotyping D1Mit119Chr 1, 10 cM D14Mit169Chr 14, 54 cM D12Mit141Chr 12, 55 cM D18Mit122Chr 18, 31 cM
Genome-Wide Scan for QTL Black = Max likelihood (EM algorithm) Blue = Haley-Knott regression
QTL-analysis in Recombinant Inbred (RI) Strains of Mice Generation of C57BL/6J XDBA/2J (BXD-RI) Strains