Download
1 / 22
220 likes | 425 Vues
Radar observations of the UTLS region. Geraint Vaughan. University of Manchester, UK. Topics. Introduction to radar VHF radar What do they measure and how? Mesoscale structure of storms Inertia-gravity waves Cloud radar. Basics of radar method. Pulses of EM radiation ~ 1 µs long

E N D
Radar observations of the UTLS region Geraint Vaughan University of Manchester, UK
Topics • Introduction to radar • VHF radar • What do they measure and how? • Mesoscale structure of storms • Inertia-gravity waves • Cloud radar
Basics of radar method • Pulses of EM radiation ~ 1 µs long • Heterodyne detection (Local Oscillator) • Doppler spectrum allows velocity of target to be measured • Polarisation of radar beam can reveal target shape • Height resolution for distributed target z=½c z Height Pulse length = 1 s z = 150 m = 0.1 s z = 15 m TIME
Doppler method Doppler shift from a moving target: = 2V/ When return signal is mixed with local oscillator, the Doppler shift of the signal is obtained. To measure the spectrum, the signal is sampled at intervals t (several return pulses combined). A Fourier transform of N points then gives the spectrum. t determines the maximum unambiguous velocity (Nyquist frequency): max = 1/(2t) Vmax = ½ max = /(4t) e.g. = 6m, t = ⅓s Vmax = 4.5 ms-1 Number of points in FT, N, determines separation of points in spectrum Let T be the length of the FT; T=Nt V = /(2T) e.g. = 6m, T = 10 s V = 0.3 ms-1
Radar targets • Particles: raindrops, ice particles. In UTLS, best observed with short wavelength radar, e.g. 78 GHz (4 mm) • Clear air: Inhomogenieties in refractive index on scale of radar wavelength: a) in troposphere, variations in humidity b) in lower stratosphere, variations in c) in mesosphere, variations in electron density In the early days of radar, clear-air echoes were called ‘angels’!
Types of radar used for UTLS Frequency and Wavelength of the IEEE Radar Band designation 300-3000 kHz 1 km-100 m ...MF3-30 MHz 100-10 m ........HF 30-300 MHz 10-1 m ..........VHF 300-3000 MHz 1 m-10 cm .. UHF 1-2 GHz ............30-15 cm ....L Band 2-4 GHz ...........15-7.5 cm.....S Band 4-8 GHz ........7.5-3.75 cm.....C Band 8-12 GHz ......3.75-2.50 cm... X Band 12-18 GHz ......2.5-1.67 cm...Ku Band 18-27 GHz .....1.67-1.11 cm....K Band 27-40 GHz 1.11 cm-7.5 mm .Ka Band 40-75 GHz...............................V Band 75-110 GHz............................W Band 110-300 GHz ......................mm Band 300-3000 GHz...................u mm Band VHF radars (50 – 70 MHz, vertically pointing – clear air radars S-band (~3 GHz) – operational weather radars 35, 78, 95 GHz – cloud radars for cirrus observations Lower frequencies used for mesospheric observations e.g HF, MF
The UK MST radar • 46.5 MHz coded pulses (6 m wavelength) • Runs continuously (24/7) • Typical height resolution 300m, time resolution 2 min • Measures echo power, winds, turbulence http://mst.nerc.ac.uk/
What does the MST measure? • Echoes mainly from clear air - precipitation echoes are possible but unusual • Winds from Doppler shift of returned echo • 3 components of wind by beam swinging (6º off zenith) – achieved by changing the phase of the EM wave across the array • Turbulence from spectral width of returned echo 6º 6º Beam width ~ 2.3º
MST Echo power • Power is proportional to potential refractivity M2: • So, high echo power denotes: • - high static stability OR • negative humidity gradient Fresnel scatter is the most common echo: anisotropic, partial reflection at small steps in the θ or q profile Strong turbulence gives Bragg scatter. This is isotropic: EM wave scattered off corresponding wave vector in turbulent field And anything in between..
Tropopause observed by MST radar Definite Tropopause Indefinite Tropopause
CH Sting Jet observed by MST radar Surface chart, midnight 27/10/02 NOAA IR, 0300 27/10/02 Comparison with UK Unified model mesoscale fields
Inertia-gravity waves Phase velocity Long-period gravity waves, affected by Earth’s rotation. Frequency ~ f Horizontal Wavelength > 100 km Vertical wavelength ~2 km Wind vector rotates elliptically with time or ht. Wave packet = ? km Group velocity z Path traced by wind vector over time Phase front
The case of July 1999 Eastward wind component measured over 4 days, 7-11 July 1999
Echo power (dB), showing that wave modulates static stability Spectral width, indicating (weak) turbulence LINES DENOTE EASTWARD WIND MAXIMA
Wave sources • Strong deceleration at jet stream level (e.g. jet exits or highly curved jets) • Baroclinic instability • Instability of a horizontal shear layer • Convection • Orographic forcing
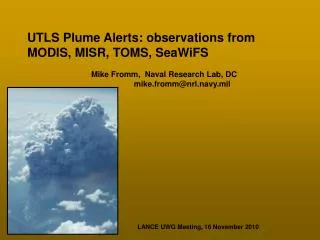
Instability of shear layer Meteosat water vapour images every 12 hrs from 06h 7 March 1997 Courtesy Heini Wernli
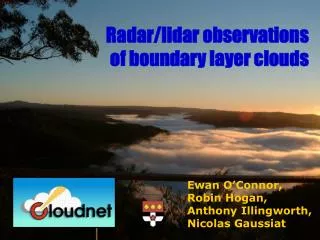
Chilbolton Observatory 35 GHz cloud radar 95 GHz cloud radar (left) and measurements of cirrus cloud, 2 June 2000. http://www.chilbolton.rl.ac.uk/ 3 GHz radar for precipitation measurements
Summary VHF radars have been the main radar tool to date for UTLS studies. They measure winds, turbulence and vertical structure and are very good for gravity waves, tropopause height and mesoscale structures There are about a dozen research radars around the world and several more used operationally Mm wave radar technology has now advanced sufficiently that cloud radars (10s of GHz in frequency) are routinely used for cirrus measurements in the UTLS Some bibliography: Doviak, R. J. and D. S. Zrnic. Doppler radar and weather observations. Academic Press, 1993. G. Vaughan. The UK MST radar. Weather, 57, 67-73, 2002. H. J. Reid and G. Vaughan. Convective mixing in a tropopause fold. Quart. J. Roy. Meteorol. Soc., 130, 1195-1212, 2004. E. Pavelin, J. Whiteway and G. Vaughan. Observation of a long-period gravity wave in the lower stratosphere. J. Geophys. Res., 106, 5153-5179, 2001. G. Vaughan and R. M. Worthington. Break-up of a stratospheric streamer observed by MST radar. Quart. J. Roy. Met. Soc., 126, 1751-69, 2000.