Download
1 / 1

E N D
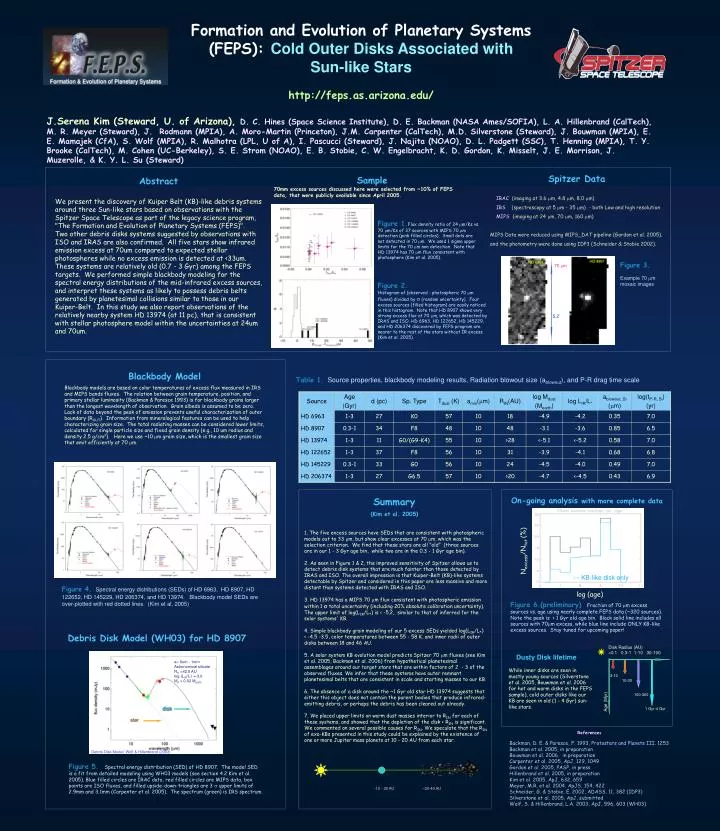
J.Serena Kim (Steward, U. of Arizona),D. C. Hines (Space Science Institute), D. E. Backman (NASA Ames/SOFIA), L. A. Hillenbrand (CalTech), M. R. Meyer (Steward), J. Rodmann (MPIA), A. Moro-Martin (Princeton), J.M. Carpenter (CalTech), M.D. Silverstone (Steward), J. Bouwman (MPIA), E. E. Mamajek (CfA), S. Wolf (MPIA), R. Malhotra (LPL, U of A), I. Pascucci (Steward), J. Najita (NOAO), D. L. Padgett (SSC), T. Henning (MPIA), T. Y. Brooke (CalTech), M. Cohen (UC-Berkeley), S. E. Strom (NOAO), E. B. Stobie, C. W. Engelbracht, K. D. Gordon, K. Misselt, J. E. Morrison, J. Muzerolle, & K. Y. L. Su (Steward) Formation and Evolution of Planetary Systems (FEPS): Cold Outer Disks Associated with Sun-like Starshttp://feps.as.arizona.edu/ Abstract We present the discovery of Kuiper Belt (KB)-like debris systems around three Sun-like stars based on observations with the Spitzer Space Telescope as part of the legacy science program, "The Formation and Evolution of Planetary Systems (FEPS)". Two other debris disks systems suggested by observations with ISO and IRAS are also confirmed. All five stars show infrared emission excess at 70um compared to expected stellar photospheres while no excess emission is detected at <33um. These systems are relatively old (0.7 - 3 Gyr) among the FEPS targets. We performed simple blackbody modeling for the spectral energy distributions of the mid-infrared excess sources, and interpret these systems as likely to possess debris belts generated by planetesimal collisions similar to those in our Kuiper-Belt. In this study we also report observations of the relatively nearby system HD 13974 (at 11 pc), that is consistent with stellar photosphere model within the uncertainties at 24um and 70um. Sample 70mm excess sources discussed here were selected from ~10% of FEPS data, that were publicly available since April 2005. Spitzer Data IRAC(imaging at 3.6 m, 4.8 m, 8.0 m) IRS(spectroscopy at 5 m - 35 m) - both Low and high resolution MIPS(imaging at 24 m, 70 m, 160 m) MIPS Data were reduced using MIPS_DAT pipeline (Gordon et al. 2005), and the photometry were done using IDP3 (Schneider & Stobie 2002). Figure 1.Flux density ratio of 24 m/Ks vs. 70 m/Ks of 37 sources with MIPS 70 m detection (pink filled circles). Small dots are not detected in 70 m. We used 1 sigma upper limits for the 70 m non detection. Note that HD 13974 has 70 m flux consistent with photosphere (Kim et al. 2005). Figure 3. Example 70 m mosaic images 70 m Figure 2. Histogram of (observed - photospheric 70 m fluxes) divided by (random uncertainty). Four excess sources (filled histogram) are easily noticed in this histogram. Note that HD 8907 shows very strong excess flux at 70 m, which was detected by IRAS and ISO. HD 6963, HD 122652, HD 145229, and HD 206374 discovered by FEPS program are nearer to the rest of the stars without IR excess (Kim et al. 2005). 5.2’ Blackbody Model Blackbody models are based on color temperatures of excess flux measured in IRS and MIPS bands fluxes. The relation between grain temperature, position, and primary stellar luminosity (Backman & Paresce 1993) is for blackbody grains larger than the longest wavelength of observation. Grain albedo is assumed to be zero. Lack of data beyond the peak of emission prevents useful characterization of outer boundary (ROUT). Information from mineralogical features can be used to help characterizing grain size. The total radiating masses can be considered lower limits, calculated for single particle size and fixed grain density (e.g., 10 um radius and density 2.5 g/cm3). Here we use ~10 m grain size, which is the smallest grain size that emit efficiently at 70 m. Table 1.Source properties, blackbody modeling results, Radiation blowout size (ablowout), and P-R drag time scale Summary (Kim et al. 2005) On-going analysis with more complete data 1. The five excess sources have SEDs that are consistent with photospheric models out to 33 m, but show clear excesses at 70 m, which was the selection criterion. We find that these stars are all "old" (three sources are in our 1 - 3 Gyr age bin, while two are in the 0.3 - 1 Gyr age bin). 2. As seen in Figure 1 & 2, the improved sensitivity of Spitzer allows us to detect debris disk systems that are much fainter than those detected by IRAS and ISO. The overall impression is that Kuiper-Belt (KB)-like systems detectable by Spitzer and considered in this paper are less massive and more distant than systems detected with IRAS and ISO. 3. HD 13974 has a MIPS 70 m flux consistent with photospheric emission within 1 total uncertainty (including 20% absolute calibration uncertainty). The upper limit of log(LIR/L*) is < -5.2, similar to that of inferred for the solar systems' KB. 4. Simple blackbody grain modeling of our 5 excess SEDs yielded log(LIR/L*) < -4.5 -3.5, color temperatures between 55 - 58 K, and inner radii of outer disks between 18 and 46 AU. 5. A solar system KB evolution model predicts Spitzer 70 m fluxes (see Kim et al. 2005, Backman et al. 2006) from hypothetical planetesimal assemblages around our target stars that are within factors of 2 - 3 of the observed fluxes. We infer that these systems have outer remnant planetesimal belts that are consistent in scale and starting masses to our KB. 6. The absence of a disk around the ~1 Gyr old star HD 13974 suggests that either this object does not contain the parent bodies that produce infrared-emitting debris, or perhaps the debris has been cleared out already. 7. We placed upper limits on warm dust masses interior to RIN for each of these systems, and showed that the depletion of the disk < RIN is significant. We commented on several possible causes for RIN. We speculate that the RIN of exo-KBs presented in this study could be explained by the existence of one or more Jupiter mass planets at 10 - 20 AU from each star. Nexcess/Ntot (%) --- KB-like disk only Figure 4.Spectral energy distributions (SEDs) of HD 6963, HD 8907, HD 122652, HD 145229, HD 206374, and HD 13974. Blackbody model SEDs are over-plotted with red dotted lines. (Kim et al. 2005) log (age) Figure 6.(preliminary) Fraction of 70 m excess sources vs. age using nearly complete FEPS data (~320 sources). Note the peak is > 1 Gyr old age bin. Black solid line includes all sources with 70m excess, while blue line include ONLY KB-like excess sources. Stay tuned for upcoming paper! Debris Disk Model (WH03) for HD 8907 Disk Radius (AU) <0.1 0.3-1 1-10 30-100 Dusty Disk lifetimeWhile inner disks are seen in mostly young sources (Silverstone et al. 2005, Bouwman et al. 2006 for hot and warm disks in the FEPS sample), cold outer disks like our KB are seen in old (1 - 4 Gyr) sun-like stars. a= 6um - 1mm Astronomical silicate Rin =42.5 AU log (LIR/L*) =-3.6 Md = 0.02 Mearth 3-10 10-30 100-300 1 Gyr-4 Gyr Age (Myr) disk star References Backman, D. E. & Paresce, F. 1993, Protostars and Planets III. 1253 Backman et al. 2005, in preparation Bouwman et al. 2006, in preparation Carpenter et al. 2005, ApJ, 129, 1049 Gordon et al. 2005, PASP, in press Hillenbrand et al. 2005, in preparation Kim et al. 2005, ApJ, 632, 659 Meyer, M.R. et al. 2004. ApJS, 154, 422 Schneider, G. & Stobie, E. 2002, ADASS, 11, 382 (IDP3) Silverstone et al. 2005, ApJ, submitted Wolf, S. & Hillenbrand, L.A. 2003, ApJ, 596, 603 (WH03) Debris Disk Model: Wolf & Hillenbrand (2003) Figure 5. Spectral energy distribution (SED) of HD 8907. The model SED is a fit from detailed modeling using WH03 models (see section 4.2 Kim et al. 2005). Blue filled circles are IRAC data, red filled circles are MIPS data, box points are ISO fluxes, and filled upside-down-triangles are 3 upper limits of 2.9mm and 3.1mm (Carpenter et al. 2005). The spectrum (green) is IRS spectrum. ~10 - 20 AU ~20-40 AU