Download
1 / 1
10 likes | 72 Vues
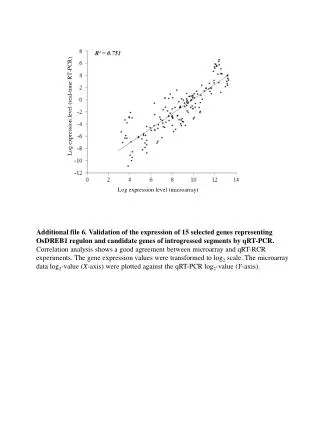
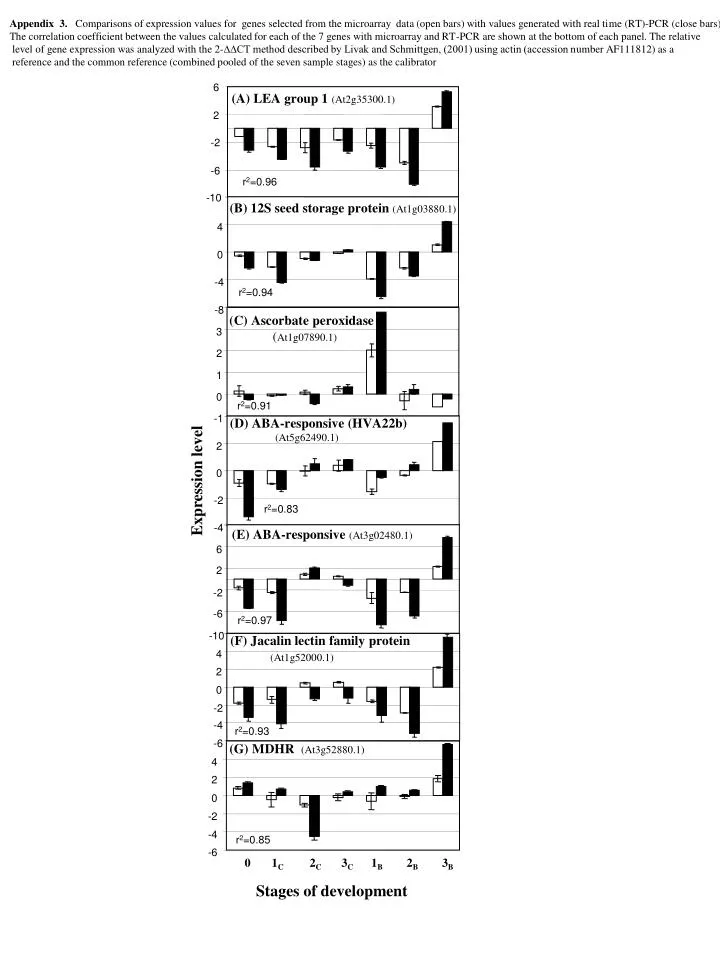
6. (A) LEA group 1 (At2g35300.1). 2. -2. -6. -10. r 2 =0.96. (B) 12S seed storage protein (At1g03880.1). r 2 =0.94. (C) Ascorbate peroxidase ( At1g07890.1). 3. 2. 1. 4. 0. (D) ABA-responsive (HVA22b) (At5g62490.1). -1. r 2 =0.91. 0. 2.

E N D
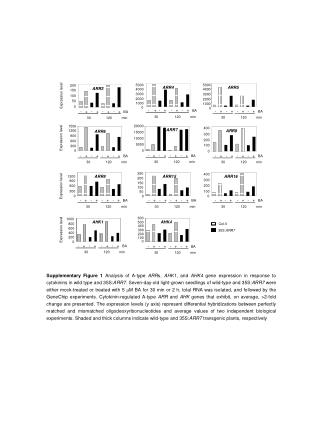
6 (A) LEA group 1 (At2g35300.1) 2 -2 -6 -10 r2=0.96 (B) 12S seed storage protein (At1g03880.1) r2=0.94 (C) Ascorbate peroxidase (At1g07890.1) 3 2 1 4 0 (D) ABA-responsive (HVA22b) (At5g62490.1) -1 r2=0.91 0 2 Expression level 0 1 -4 -2 -4 (E) ABA-responsive (At3g02480.1) r2=0.83 -8 6 2 -2 -6 -10 (F) Jacalin lectin family protein (At1g52000.1) 4 2 0 -2 -4 (G) MDHR (At3g52880.1) -6 4 2 0 Stages of development -2 0 1C 2C 3C 1B 2B 3B -4 -6 Appendix 3. Comparisons of expression values for genes selected from the microarray data (open bars) with values generated with real time (RT)-PCR (close bars). The correlation coefficient between the values calculated for each of the 7 genes with microarray and RT-PCR are shown at the bottom of each panel. The relative level of gene expression was analyzed with the 2-∆∆CT method described by Livak and Schmittgen, (2001) using actin (accession number AF111812) as a reference and the common reference (combined pooled of the seven sample stages) as the calibrator r2=0.97 r2=0.93 r2=0.85