Download

1 / 20
200 likes | 337 Vues
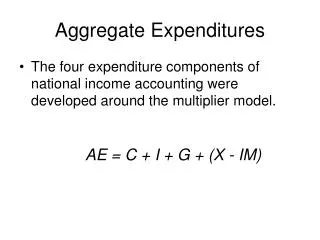
Building the Aggregate Expenditures Model. What is an aggregate expenditure?. Aggregate – “Total” or “Combined” Expenditure – “spending” Now, put them together, and what do we have? Total Spending!!!! Yeah!!!! .

E N D
What is an aggregate expenditure? • Aggregate – “Total” or “Combined” • Expenditure – “spending” • Now, put them together, and what do we have? • Total Spending!!!! • Yeah!!!!
Basically, the aggregate expenditures model refers to the economy’s total spending. • This model is used to illustrate the equality between spending (consumption and investment) and output (GDP) • Remember….OUTPUT = GDP!
Background Info. • Two theories about Agg. Ex. • 1. Classical Economic Theory • Supported by Say’s Law – “Supply creates it’s own Demand” • Production of one good/service automatically generates the income necessary to demand other goods/services. • A true market system will ensure full employment and high output. • Economic hardships will be self-corrected through continual production, no government intervention needed whatsoever.
Keynesian Economic Theory • Pronounced “Cane-Sian” • Created by in John Maynard Keynes in 1936 as a result of economic analysis regarding the Great Depression. • Notes that due to circumstances beyond the control of the economy (war, debt, overspending, underspending, natural disasters), there will always be brief/sustained periods when all income will not be spent on the output from which it is produced. • So, The GOVERNMENT must intervene or “stimulate” the economy during these times of economic hardship. • Yeah!!!!!
So, what are we actually looking at with the Agg. Exp. Model? • The Agg. Exp. Model is a basic Macroeconomic theory that states: • the amount of goods and services produced and therefore the level of employment depends directly on the level of total or aggregate expanditures.
Let’s build ourselves a model! • Income-consumption-savings relationships • Basic Assumption from graph • Any point on the reference line is a point in which C = DI • Therefore, any point below the reference line is a period of savings, any point above the reference line is a period of “dissavings” • Yeah!!!!
What does this mean? • The relationship between Consumption, Savings, and Income can be broken down into two categories: • 1. Average Propensity • 2. Marginal Propensity
Average Propensity • The fraction, or percentage, of any total income which is consumed/saved is the average propensity to do so • Average Propensity to Consume (APC) • Equals Consumption / Income • Average Propensity to Save (APS) • Equals Saving / Income • APC + APS = 1
Marginal Propensity • The proportion, or fraction, of any change in income consumed is the marginal propensity to consume/save • Marginal Propensity to Consume (MPC) – the ratio of change between consumption and income • Equals Change in consumption / Change in income • Marginal Propensity to Save – the ratio of change between savings and income • Equals Change in saving / change in income • MPC + MPS = 1 • Yeah!!!!
Let’s see what you can do so far!!!! • Worksheet Time….Yeah!!!!!
Part Deuce: Investment and Equilibrium GDP • To refresh: • GDP/output = Production • Aggregate Expenditures = Cost • Producers are willing to offer any level of output that is at least equal to it’s costs of production
Equilibrium GDP • Equilibrium GDP is that output where production will create total spending that is equal to it’s output. • Another way of saying the same thing: • Equilibrium level of GDP occurs where the total output, measured by GDP, and aggregate expenditures, C + I, are equal • In other words, where Real GDP = Aggregate Expenditures • Why can’t other levels of GDP be feasible sustained?
Below Equilibrium • If an economy is producing real GDP at 300 billion • And it’s consumption is at 290 billion • And Investment is at 25 billion • Then Aggregate Expenditures = 315 billion • There is a difference of 15 • This number (15) is negative because “people” are consuming and investing goods and services at a faster rate than they are being produced…. • How could an economy cope with this to achieve equilibrium? • Increase employment!!!
Above Equilibrium • If an economy is producing real GDP at 300 billion • And it’s consumption is at 240 billion • And Investment is at 25 billion • Then Aggregate Expenditures (C + I) = 265 billion • There is a difference of 35 billion • This number is positive because the economy/producer is producing at a faster rate than consumers are consuming (buying) and investing…. • How could an economy cope with this to achieve equilibrium? • Decrease employment!!!
Investment • Two types • 1. Planned • Does not account for unintended or “unplanned” investment • 2. Actual • Equal to savings • Planned investment + unplanned investment
Now let’s add Investment….calculate Agg. Exp. And determine Equilibrium GDP