Download
1 / 10
100 likes | 105 Vues
Methods 1 Lab. Lecture 12. Data. Get the data from Moodle into SPSS Lecture 12 Data. 2 Way ANOVA. Analyze General Linear Model Univariate Dependent Variable – Coffee Intake Fixed Factors – GraduateStudent & CoffeeDrinker Ok. Regression. Analyze Regression Linear

E N D
Methods 1 Lab Lecture 12
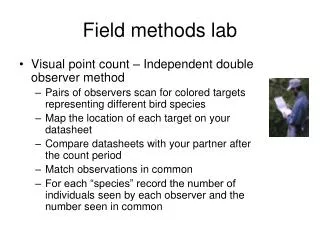
Data • Get the data from Moodle into SPSS • Lecture 12 Data
2 Way ANOVA • Analyze • General Linear Model • Univariate • Dependent Variable – Coffee Intake • Fixed Factors – GraduateStudent & CoffeeDrinker • Ok
Regression • Analyze • Regression • Linear • Dependent – BloodPressure • Block 1 0f 1 – CoffeeIntake • Plots • Y - *ZRESID • X - *ZPRED • Check Histogram and Normal Probability Plot • Ok
Regression • R-squared = .474 -> this means that approximately 47% of the variation in Blood Pressure can be explained by Coffee Intake • Beta = 3.694 -> for every 1 unit increase in Coffee Intake there is on average an increase in Blood Pressure by 3.694 units.
Correlation • Analyze • Correlate • Bivariate • Check Pearson and Spearman • Ok