Download
1 / 23
330 likes | 820 Vues
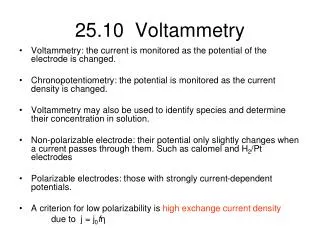
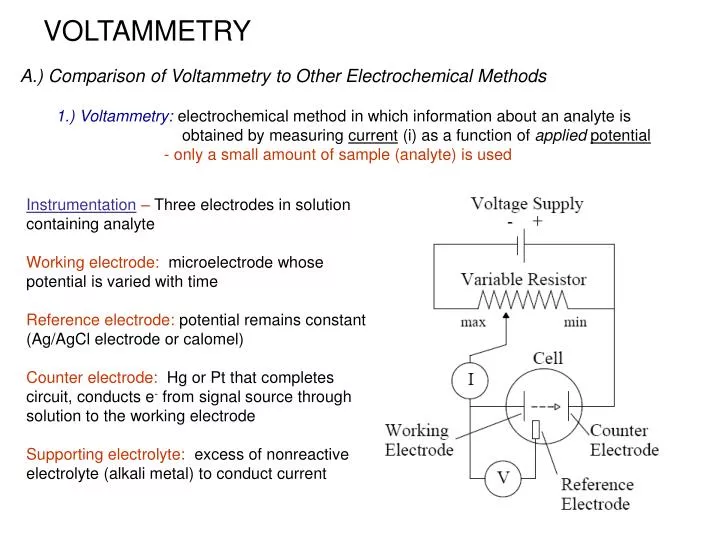
VOLTAMMETRY. A.) Comparison of Voltammetry to Other Electrochemical Methods 1.) Voltammetry: electrochemical method in which information about an analyte is obtained by measuring current (i) as a function of applied potential - only a small amount of sample (analyte) is used.

E N D
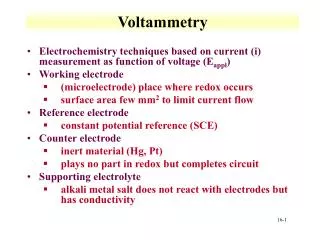
VOLTAMMETRY A.) Comparison of Voltammetry to Other Electrochemical Methods 1.) Voltammetry: electrochemical method in which information about an analyte is obtained by measuring current (i) as a function of appliedpotential - only a small amount of sample (analyte) is used Instrumentation – Three electrodes in solution containing analyte Working electrode: microelectrode whose potential is varied with time Reference electrode: potential remains constant (Ag/AgCl electrode or calomel) Counter electrode: Hg or Pt that completes circuit, conducts e- from signal source through solution to the working electrode Supporting electrolyte: excess of nonreactive electrolyte (alkali metal) to conduct current
Apply Linear Potential with Time Observe Current Changes with Applied Potential 2.) Differences from Other Electrochemical Methods a)Potentiometry: measure potential of sample or system at or near zero current. voltammetry – measure current as a change in potential b)Coulometry: use up all of analyte in process of measurement at fixed current or potential voltammetry – use only small amount of analyte while vary potential
3.) Voltammetry first reported in 1922 by Czech Chemist Jaroslav Heyrovsky (polarography). Later given Nobel Prize for method. B.) Theory of Voltammetry 1.) Excitation Source: potential set by instrument (working electrode) - establishes concentration of Reduced and Oxidized Species at electrode based on Nernst Equation: - reaction at the surface of the electrode (aR)r(aS)s … 0.0592 Eelectrode =E0 - log n (aP)p(aQ)q … Apply Potential
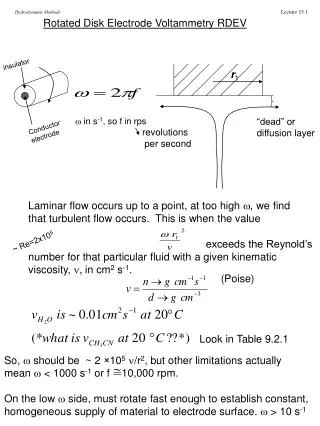
Current is just measure of rate at which species can be brought to electrode surface Two methods: Stirred - hydrodynamic voltammetry Unstirred - polarography (dropping Hg electrode) Three transport mechanisms: (i) migration – movement of ions through solution by electrostatic attraction to charged electrode (ii) convection – mechanical motion of the solution as a result of stirring or flow (iii) diffusion – motion of a species caused by a concentration gradient
Voltammetric analysis • Analyte selectivity is provided by the applied potential on the working electrode. • Electroactive species in the sample solution are drawn towards the working electrode where a half-cell redox reaction takes place. • Another corresponding half-cell redox reaction will also take place at the counter electrode to complete the electron flow. • The resultant current flowing through the electrochemical cell reflects the activity (i.e. concentration) of the electroactive species involved Pt working electrode at -1.0 V vs SCE Ag counter electrode at 0.0 V AgCl Ag + Cl- Pb2+ + 2e- Pb EO = -0.13 V vs. NHE K+ + e- K EO = -2.93 V vs. NHE SCE X M of PbCl2 0.1M KCl
Pb2+ + 2e- Pb -1.0 V vs SCE Concentration gradient created between the surrounding of the electrode and the bulk solution K+ K+ Pb2+ Pb2+ Pb2+ K+ Pb2+ Pb2+ K+ K+ K+ K+ K+ Pb2+ K+ Pb2+ K+ Pb2+ Pb2+ K+ Pb2+ K+ K+ K+ Pb2+ K+ K+ K+ Pb2+ Pb2+ Pb2+ K+ Pb2+ migrate to the electrode via diffusion K+ Pb2+ K+ Pb2+ Pb2+ K+ Pb2+ Pb2+ K+ Pb2+ Pb2+ K+ K+ K+ K+ Layers of K+ build up around the electrode stop the migration of Pb2+ via coulombic attraction
Mox + e-»Mred At Electrodes Surface: Eappl = Eo - log [Mred]s 0.0592 at surface of electrode n [Mox]s Applied potential If Eappl = Eo: 0 = log ˆ [Mox]s = [Mred]s [Mred]s 0.0592 n [Mox]s
Apply Potential E << Eo If Eappl << Eo: Eappl = E0 - log ˆ [Mred]s >> [Mox]s [Mred]s 0.0592 n [Mox]s
2.) Current generated at electrode by this process is proportional to concentration at surface, which in turn is equal to the bulk concentration For a planar electrode: measured current (i) = nFADA( ) where: n = number of electrons in ½ cell reaction F = Faraday’s constant A = electrode area (cm2) D = diffusion coefficient (cm2/s) of A (oxidant) = slope of curve between CMox,bulk and CMox,s dCA dx dCA dx dCA dx
As time increases, push banding further and further out. Results in a decrease in current with time until reach point where convection of analyte takes over and diffusion no longer a rate-limiting process.
Thickness of Diffusion Layer (d): i = (cox, bulk – cox,s) - largest slope (highest current) will occur if: Eappl << Eo (cox,s.0) then i = (cox, bulk – 0) where: k = so: i = kcox,bulk therefore: current is proportional to bulk concentration - also, as solution is stirred,ddecreasesand iincreases nFADox d nFADox d nFADox d
Electrode become more and more reducing and capable of reducing Cd2+ Cd2+ + 2e- Cd Current starts to be registered at the electrode All Cd2+ around the electrode has already been reduced. Current at the electrode becomes limited by the diffusion rate of Cd2+ from the bulk solution to the electrode. Thus, current stops rising and levels off at a plateau Working electrode is no yet capable of reducing Cd2+ only small residual current flow through the electrode Current at the working electrode continue to rise as the electrode become more reducing and more Cd2+ around the electrode are being reduced. Diffusion of Cd2+ does not limit the current yet Potential applied on the working electrode is usually swept over (i.e. scan) a pre-defined range of applied potential 0.001 M Cd2+ in 0.1 M KNO3 supporting electrolyte i (A) E½ id Base line of residual current -0.2 -0.4 -0.6 -0.8 -1.0 -1.2 -1.4 V vs SCE
3.) Combining Potential and Current Together Limiting current Related to concentration E½ at ½ i Half-wave potential : E1/2 = -0.5 .E0 - Eref E0 = -0.5+SCE for Mn+ + me- » M(n-m)+
4.) Types of Voltammetry a)Polarography 1) first type of Voltammetry 2) controlled by diffusion, eliminates convection 3) uses dropping Hg electrode (DME) as working electrode current varies as drop grows then falls off
4) Advantages of Hg drop Electrode a) high overpotential for reduction of H+ 2H+ + 2e- » H2 (g) allows use of Hg electrode at lower potentials than indicated from thermodynamic potentials eg. Zn2+ and Cd2+ can be reduced in acidic solutions even though Eo’s vs. SHE = -0.403 (Cd2+/Cd) & -0.763 (Zn2+/Zn) b) new electrode surface is continuously generated - independent of past samples or absorbed impurities c) reproducible currents quickly produced
5) Disadvantages of Hg drop Electrode a) Ease of Hg0 oxidation Hg0»Hg+ + e- E0 = +0.4V ˆcan not use above this potential Occurs at even lower potentials in presence of ions that complex Hg+ ex. Cl-: 2Hg + 2Cl-»Hg2Cl2 (s) + 2 e- starts at .0V b) Non-Faradaic (charging) current - limits the sensitivity to ~ 10-5 M - residual current is > diffusion current at lower concentrations c) cumbersome to use - tends to clog causing malfunction - causes non-uniform potential maxima d) Hg disposal problems
Mn+ + ne- +Hg » M(Hg) amalgam i max i avg The ripples are caused by the constant forming and dropping of the mercury electrode Half-wave potential Residual current 6) Classic Polarography a) ½ wave potential (E½) characteristic of Mn+ E0 b) height of either average current maxima (i avg) or top current max (i max) is ~ analyte concentration c) size of i max is governed by rate of growth of DME -> drop time (t, sec) rate of mercury flow (m, mg/s) diffusion coefficient of analyte (D, cm2/s) number of electrons in process (n) analyte concentration (c, mol/ml) Ilkovic equation: (id)max = 706nD1/2m2/3t1/6c (id)avg = 607nD1/2m2/3t1/6c A
d) necessary to do experiment with sample and blank to see analyte signal vs. residual current - residual current due to impurities and charging (nonfaradaic) currents e) can use method to quantitate or identify elements in sample down to ~ 10-5 M f) can also use method to study reactions involving Mn+ as long as reaction is reversible ex. Mn+ + ne- +Hg » M0(Hg) amalgam plus reaction: Mn+ + xA-» MAx(n-x)+ (E1/2)with complex – (E1/2)without complex = -0.0592/n log Kf – 0.0592x/n log [A-] ˆ plot of(E1/2)with complex – (E1/2)without complex vs. log[A-] gives slope and intercept that can be used to give Kf and x Kf
One problem with data detection in normal polarography is that i varies over lifetime of drop, giving variation on i over curve. One simple way to avoid this is to sample only current at particular time of drop life. Near end of drop = current sampled polarography Sample i at same time interval Easier to determine iavg, etc but limit of detection only slightly smaller (~3x)
7) Pulse Polarography a) Instead of linear change in Eappl with time use step changes (pulses in Eappl) with time b) Measure two potentials at each cycle - S1 before pulse S2 at end of pulse - plot Di vs. E (Di = ES2 – ES1) - peak height ~ concentration - for reversible reaction, peak potential -> standard potential for ½ reaction c) derivative-type polarogram d) Advantages: - can detect peak maxima differing by as mucha as 0.044 – 0.05 V <0.2V peak separatioin for normal polarography <can do more elements per run - decrease limits of detection by 100-1000x compared to normal polarography
e) Reasons for Decrease in Limits of Detection - increase Faradaic current <surge of current that lowers reactant concentration demanded by new potential ‚ not seen in classic polarography ‚ timescale of measurments is long compared to lifetime of momentary surge <current decays to a level just sufficient to counteract diffusion < total current >> diffusion current ‚ reducing surface layer to concentration demanded by Nernst equation - decrease in non-Faradaic current < surge of non-Faradaic current also occurs as charge on drop increases ‚ current decays exponentially with time ‚ approaches zero near the end of the life of a drop < measure current at end of drop lifetime significantly reduces non- Faradaic current < signal-to-noise increases f) Can do differential pulse and square wave polarography on other types of electrodes - called differential or square wave voltammetry
b)Cyclic Voltammetry 1) Method used to look at mechanisms of redox reactions in solution 2) Looks at i vs. E response of small, stationary electrode in unstirred solution using triangular waveform for excitation Cyclic voltammogram
Start at E >> E0 Mox + ne-»Mred - in forward scan, as E approaches E0 get current due to Mox + ne-»Mred <driven by Nernst equation ‚ concentrations made to meet Nernst equation at surface <eventually reach i max < solution not stirred, so d grows with time and see decrease in i max - in reverse scan see less current as potential increases until reduction no longer occurs < then reverse reaction takes place (if reversible reaction) < important parameters ‚Epc – cathodic peak potential ‚ Epa – anodic peak potential ‚ipc – cathodic peak current ‚ ipa – anodic peak potential < ipc.ipa <d(Epa – Epc) = 0.0592/n, where n = number of electrons in reaction <E0 = midpoint of Epa Epc