Download
1 / 9
90 likes | 275 Vues
Anthropogenic emissions of highly reactive VOCs (HRVOCs) inferred from oversampling of OMI formaldehyde (HCHO) columns And its application to Houston-Galveston-Brazoria (HGB) area. OMI HCHO 2006 JJA average.

E N D
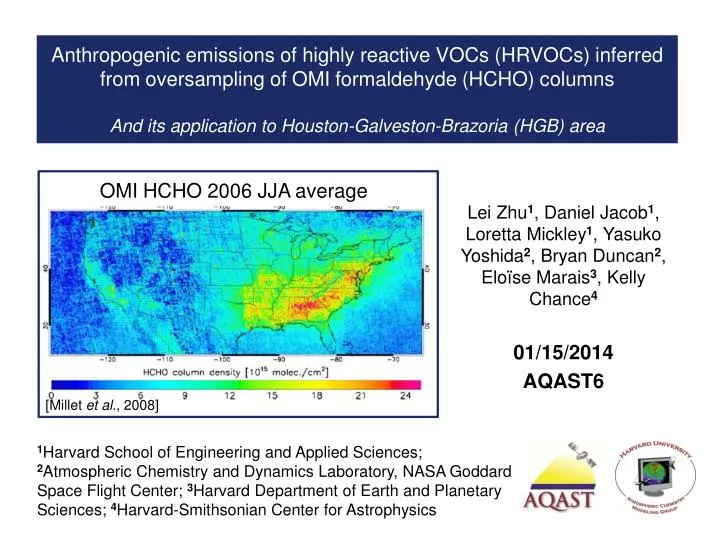
Anthropogenic emissions of highly reactive VOCs (HRVOCs) inferred from oversampling of OMIformaldehyde (HCHO) columnsAnd its application to Houston-Galveston-Brazoria (HGB) area OMI HCHO 2006JJA average Lei Zhu1, Daniel Jacob1, Loretta Mickley1, Yasuko Yoshida2, Bryan Duncan2,Eloïse Marais3, Kelly Chance4 01/15/2014 AQAST6 [Millet et al., 2008] 1Harvard School of Engineering and Applied Sciences; 2Atmospheric Chemistry and Dynamics Laboratory, NASA Goddard Space Flight Center; 3Harvard Department of Earth and Planetary Sciences; 4Harvard-Smithsonian Center for Astrophysics
Relating HCHO columns to HRVOCs h(340 nm), OH oxidation VOCi HCHO k ~ 0.5 h-1 yield yi Emission Ei In absence of horizontal wind, mass balance for HCHO column WHCHO: but wind smears this relationship WHCHO Isoprene Propylene Beyond this distance, HCHO is mainly contributed by long-lived VOCs Ethylene WHCHO – W0 W0 methanol Distance downwind VOCs source
Oversampling approach to detect point sources • Oversampling:temporal averaging of the satellite data on a spatial gridmuchfiner than the pixel resolution of the instrument • Takes advantage of the spatial offset and changing geometry of the satellite pixels from day to day • Tradestemporal for spatial resolution • Achieves higher signal-to-noise ratio data SmoothingRadius 2km A satellitepixel 24×13km2 • Optimize smoothing radius: • Too fine (12 km): Increase noise • Too coarse (36 km): Lose spatial features 2005-2008 MJJAS 26028pixels in a 1°×1° box
Results: Oversampling of OMI HCHO pixels OMI HCHO column, 2005-2008, MJJA OMIHCHOcolumn (molec./cm2) Barnett Shale Biogenic Temperature(K) Oversampling approachenables detection of anthropogenic HRVOCs from point/urban sources and gas operations.
Reactivity-weighted HRVOCs emissions in HGB area based on top-downapproach OMI HCHO column 2005-2008, MJJA HCHOVCD Integrationof HCHO columns overHGB 180km HCHO lossrate HCHOVCDfrom long-livedVOCs Reactivity-weighted HRVOCs in HGB Top-downconstraint: 13.7±5.2 Gg C/year NEI08 estimation: 4.5Gg C/year Parrish et al. [2012]: 25.2±1.1 Gg C/year
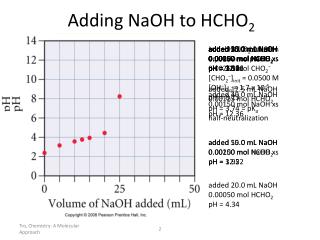
HRVOCs emissions and secondary HCHO in HGB area Understanding relative contribution of secondary play an important role in developing ozone control strategies Secondary HCHO contribution near Houston: 24±17%, Rappenglück, et al., [2010] 36%, Guvenand Olaguer [2011] 63%, Friedfeldet al., [2002] 92%, Parrish et al., [2012] 10HRVOCsemissions from NEI08 Total=9.1GgC/year
Distinguish primary and secondary HCHO based on plume structure ki k u VOCi HCHO Yi Ei Distance downwind Column model Primary Secondary Houston NEI08 underestimates secondary HCHO by 3~6 times
AQ managers: Are there any specific areas or periods that you would want me to look at? Takehomemessages Oversampling ofOMIHCHOcolumnsprovides a newsolutionto thelong-standingproblemofdetectingandquantifyinganthropogenic HRVOCs emissionsfromspace HCHO columns can go as fine as 0.02 degree (~2 km)! 2005-2008, available 2008-now, processing Other urbanareas? VOCspointsourcesregions? Gas/oilfields? Trends? Top-down constraint showsreactivity-weighted HRVOCs emissioninHGBis13.7±5.2 Gg C/year,3.0±1.2 timeshigher than thatestimated usingNEI08