Download
1 / 26
260 likes | 382 Vues
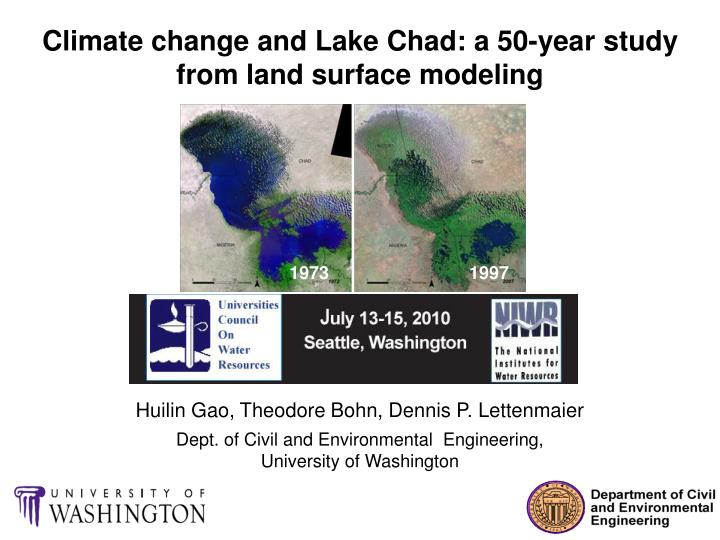
Climate change and Lake Chad: a 50-year study from land surface modeling Huilin Gao, Theodore Bohn, Dennis P. Lettenmaier Dept. of Civil and Environmental Engineering, University of Washington. 1973 1997. Outline. Background and motivation

E N D
Climate change and Lake Chad: a 50-year study from land surface modeling Huilin Gao, Theodore Bohn, Dennis P. Lettenmaier Dept. of Civil and Environmental Engineering, University of Washington 1973 1997
Outline • Background and motivation • Introduction to the hydrological model and its lake/wetland algorithms • Modeling results • Simulated river runoff into Lake Chad; • A 50-year simulation of Lake Chad dynamics and its validation; • A set of experiments to test the impacts of human water usage versus lake bathymetry under the changing climate; • 4. Conclusions
Lake Chad basin and Lake Chad • Largest endoreic basin in the world • 2,500,000 km2 • Fourth largest lake in Africa 40 years ago
Climatology and water resources over the Lake Chad basin Provides 98% inflow for Lake Chad
The loss of Lake Chad: what happened? Climate change? Human water usage? Something unique? Can we quantify these by hydrological modeling? ? 12/25/1972 01/31/1987 02/06/2007 10/31/1963 precipitation
Variable Infiltration Capacity (VIC) model • Semi-distributed model driven by a set of surface meteorological data • Represents vegetation, has three soil layers with variable infiltration, non linear base flow • Simulated hydrology at each grid cell for all time steps • Well calibrated and applied in a number of large river basins over the continental US and the globe.
VIC lake algorithm I: Evaporation from the lake is calculated via energy balance; II: Runoff enters the lake from the land surface; III: Runoff out of the lake is calculated based on the new stage; IV: The stage is re-calculated. (Bowling and Lettenmaier, JHM, 2010)
VIC wetland algorithm a) when the lake is at its maximum extent the soil column is saturated; b) as the lake shrinks runoff from the land surface enters the lake; c) evaporation from the land surface depletes soil moisture; d) as the lake grows, water from the lake recharges the wetland soil moisture. (Bowling and Lettenmaier, JHM, 2010)
Modeling strategy and results Analyzing Lake Chad from a hydrological perspective …… 12/25/1972 01/31/1987 02/06/2007 10/31/1963 • i) Simulate river runoff from the Lake Chad basin into the lake; • - How much is the irrigation water usage in the basin? • ii) Validate the modeled lake dynamics (1952-2006) using gauge and satellite observations; • - How well could the model capture the loss of Lake Chad? • iii) A set of experiments to test the impacts due to climate change, human water usage, and lake bathymetry. • - How much do these factors affect Lake Chad?
i) VIC simulated runoff and the impact of irrigation water usage 5000 4000 3000 2000 1000 0 observed simulated (m^3/s) 1953 1963 1973 1983 1993 2003 no irrigation lot irrigation Modeling and observation differences in recent years are due to irrigation
i) VIC simulated runoff and the impact of irrigation water usage 5000 4000 3000 2000 1000 0 observed simulated (m^3/s) 1953 1963 1973 1983 1993 2003 no irrigation lot irrigation 4000 3000 2000 1000 0 4000 3000 2000 1000 0 1983-2004 1954-1979 irrigation observed simulated observed simulated (m^3/s) (m^3/s) Feb May Aug Nov Feb May Aug Nov
ii) The unique bathymetry of Lake Chad • River Chari provides 98% of the river inflow into Lake Chad from the south; 284 283 282 281 280 279 278 277 276 • When water is effluent/deep, the lake behaves as one lake; • When water level retreats below the barrier, the lake splits into two parts. Bol (gauge) Great barrier Great barrier Komadugu Logone-Chari (m)
ii) Validation of modeled lake depth (observations from gauge and satellite altimetry) 12 10 8 6 4 2 0 gauge One lake historical split Lake depth (m)
ii) Validation of modeled lake depth (observations from gauge and satellite altimetry) 12 10 8 6 4 2 0 gauge One lake historical split Lake depth (m) south lake north lake
ii) Validation of modeled lake depth (observations from gauge and satellite altimetry) 12 10 8 6 4 2 0 gauge One lake satellite historical split Lake depth (m) Altimeter anomaly (m) south lake north lake
ii) Validation of modeled lake surface area (observations from satellite imagery) Landsat/aircraft derived water coverage VIC simulated lake area Landsat/aircraft images A B C 10/31/1963 12/25/1972 01/31/1987 (Landsat/aircraft water classification by E. Podest at JPL)
iii) The changing role of Lake Chad in basin water storage Terrestrial water storage (mm) Period 1 Period 2 Period 3
iii) Irrigation impact: lake depth 12 10 8 6 4 2 0 historical split Lake depth (m) Irrigated (south lake) Irrigated (north lake)
iii) Irrigation impact: lake depth 12 10 8 6 4 2 0 Small impacts: Delayed dry-out in north lake; Increased lake level in south lake. not irrigated (south lake) historical split Lake depth (m) Irrigated (south lake) not irrigated (north lake) Irrigated (north lake)
iii) Split/bathymetry impact: lake depth 12 10 8 6 4 2 0 no split no historical split Lake depth (m) irrigated If the lake did not split, Lake Chad still would have shrunk dramatically
iii) Isolation/bathymetry impact: lake depth 12 10 8 6 4 2 0 Irrigation impact would be magnified if the historical split of the lake did not occur not irrigated no historical split Lake depth (m) irrigated
iii) Irrigation vs split: lake area & volume before split after split, no irrigation after split
iii) Irrigation vs split: lake area & volume no split, no irrigation no split before split after split, no irrigation after split
iii) Irrigation vs split: lake area & volume no split, no irrigation no split before split after split, no irrigation after split no split, no irrigation before split no split after split, no irrigation after split
Conclusions • During the last 50 years, Lake Chad has experienced the normal period, the transition period, and the small lake period. • The VIC lake/wetland model simulated lake dynamics are very consistent with gauge data and satellite observations; • Climate change (droughts in the 70’s and 80’s) is the main cause of the loss of Lake Chad; • The intensified human water usage has worsened the shrinking of Lake Chad; • More than anything else, the unique characteristic of Lake Chad’s bathymetry is the major factor preventing it from recovering (to the ‘big lake’).
Climate change and Lake Chad: a 50-year study from land surface modeling Huilin Gao, Theodore Bohn, Dennis P. Lettenmaier Dept. of Civil and Environmental Engineering, University of Washington Thanks! Questions?