Download
1 / 27
270 likes | 277 Vues
Subseasonal variability of North American wintertime surface air temperature. Hai Lin RPN, Environment Canada August 19, 2014 WWOSC, Montreal. Outline. Introduction Objectives Data Dominant patterns of subseasonal T2m variability Precursors and signal sources

E N D
Subseasonal variability of North American wintertime surface air temperature Hai Lin RPN, Environment Canada August 19, 2014 WWOSC, Montreal
Outline • Introduction • Objectives • Data • Dominant patterns of subseasonal T2m variability • Precursors and signal sources • Implication to model development and numerical predictions • Conclusion
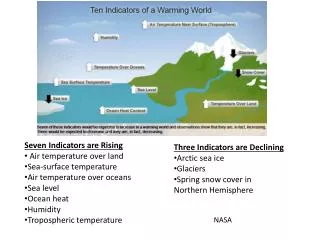
Introduction • Subseasonal time scale: a week to a season • Importance: surface air temperature (SAT) variability impact on societal and economical activities e.g., persistent extreme cold: health problem, energy, transportation, etc
Objectives • Identify thedominant patterns of wintertime subseasonal SAT variability in North America • Associated large-scale atmospheric circulation • Identify precursors that lead to the subseasonal SAT variability • Mechanism and predictability source • Determine potential predictability
Data and method • Daily averaged NCEP/NCAR reanalysis • Pentad (5-day) average • Extended winter: November to March (30 pentads) • 1979-2013 (34 extended winters) • Remove seasonal cycle, and seasonal mean to get anomaly for subseasonal variability • EOF analysis
EOF1 • Continental scale • 23% of total variance • Tends to have a period of 50 days What is the process and mechanism leading to EOF1 variability? Lagged regression analysis of circulation wrt PC1
T2m −3 pentads −2 pentads −1 pentads simultaneous
Precursor: Cold surge in East Asia? • Siberian high • East Asian jet intensification • Low level convergence in the tropics
SLP −3 pentads −2 pentads −1 pentads simultaneous
EOF2 • Dipole structure • 15% of total variance • Tends to have a period of 70 days
Is EOF2 influenced by the MJO? • But why EOF2 has a period of 70 days, instead of 30-50 days?
Power spectrum of RMM time series(in 24 extended winters November-March) RMM1 and RMM2 are widely used MJO index, by Wheeler and Hendon (2004).
EOF2 and MJO • The MJO in winter has a slow and a fast component • EOF2 is influenced by the slow component
EOF3 and EOF4 • Spatial phase shift to each other • PC4 lags PC3 by 2 pentads • Represent northeastward propagation • Combined 21% of total variance • Both tend to have a period of 40 days (same frequency as the fast MJO component) • Independent and dependent components
Implication • All four leading modes have precursors about 3 pentads in advance potential predictability • All four leading modes have tropical connection. • EOF1 has an indirect connection (tropical Pacific convection serves as a “bridge”) • EOF2, EOF3 and EOF4 have a direct link to the tropical MJO • Importance of tropics in subseasonal prediction: data assimilation and initialization, model physics, etc.
Summary • Four leading modes account for 60% of total variance • EOF1: continental scale same sign; associated with PNA; East Asian cold surge as a precursor • EOF2: northwest-southeast dipole structure; 70 day period; related to the low-frequency component of MJO • EOF3 and EOF4 are partially related. Associated with the fast MJO component • Would be interesting to see how GCMs simulates these processes…