Download
1 / 9
90 likes | 314 Vues
5-7 Scatter Plots and Trend Lines. Objective: Write an equation of a trend line and a line of best fit Use trend lines and line of best fit to make predictions. 5-7 Scatter Plots and Trend Lines. Scatter plat is a graph that relates two different sets of data as an ordered pair.

E N D
5-7 Scatter Plots and Trend Lines Objective: Write an equation of a trend line and a line of best fit Use trend lines and line of best fit to make predictions
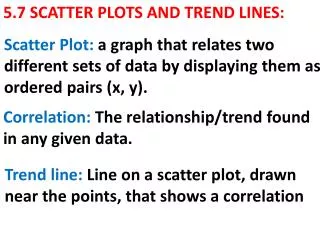
5-7 Scatter Plots and Trend Lines • Scatter plat is a graph that relates two different sets of data as an ordered pair. • Most scatter plats are in the first quadrant because the data is positive.
5-7 Scatter Plots and Trend Lines • Three type of relationships:
5-7 Scatter Plots and Trend Lines • Vocabulary: • Trend Line is a line on a scatter plot drawn near points to show correlation. • Interpolation is estimating a value between two known values • Extrapolation is predicting a value outside the range of known values.
5-7 Scatter Plots and Trend Lines • Vocabulary: • Line of best fit: the trend line that shows relationship most accurately. • Correlation coefficient, ra number from graphing calculator from -1 to 1, that tells you how closely the equation models the data. • r= -1 r = 0 r= 1 • Strong no Strong • Negative Positive
5-7 Scatter Plots and Trend Lines • Example 1: Make a scatter plot and describe correlation. Hand out graph paper.
5-7 Scatter Plots and Trend Lines • Example 2: Make a scatter plot, What is the approximate weight of a 7 month old panda. • Make a scatter plot and draw a trend • line. Estimate two coordinates on line and find slope. Use pt/slope form to • write an equation of a line. • Calculate weight of 7 month old panda.
5-7 Scatter Plots and Trend Lines • Example 3: If time Page 339 and graphing calculators.
5-7 Scatter Plots and Trend Lines • HW p. 341 7 – 11 odds, 20, 23 – 26 p. 343.