Download

1 / 20
200 likes | 203 Vues
5th U.S. Drought Monitor Forum, Portland 11oct07. La Niña is back: Drought Prospects in the Western U.S., and the Utility of Improved Climate Divisions. Klaus Wolter (klaus.wolter@noaa.gov) University of Colorado, CIRES/CDC & NOAA-ESRL/PSD Climate Analysis Branch

E N D
5th U.S. Drought Monitor Forum, Portland 11oct07 La Niña is back: Drought Prospects in the Western U.S., and the Utility of Improved Climate Divisions Klaus Wolter (klaus.wolter@noaa.gov) University of Colorado, CIRES/CDC & NOAA-ESRL/PSD Climate Analysis Branch <with help from David Allured and Jon Eischeid> •The verdict is in: it’s a La Niña! •What does that mean for the (Western) U.S.?! • Why bother with Climate Divisions?
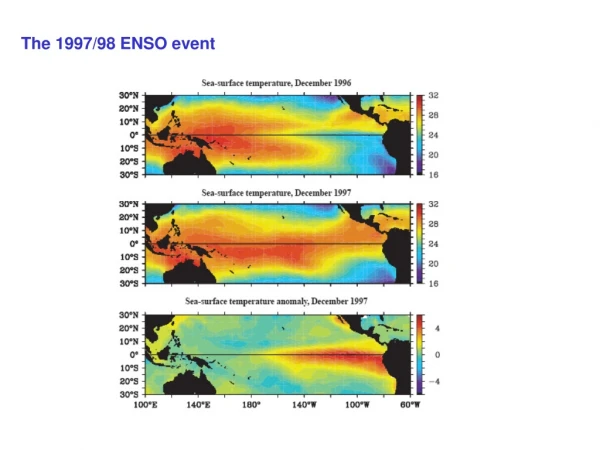
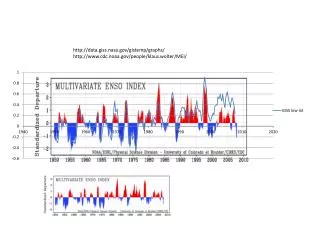
Current state of ENSO (bottom) compared to three months ago (top): after a sharp drop in early 2007, we have seen mostly La Niña-like conditions in the Eastern Pacific since this spring (top), while the all-important central Pacific remained ‘neutral’ into August - boy, has that changed (bottom)! However, the wind anomalies have weakened considerably in the last few weeks.
Caveat: The traditional SOI is still ‘sitting on the fence’ with regard to the currently developing La Niña. This index has been unusually out-of-sync with other ENSO indices for more than a year now.
A late starter! 2007 transition from about +1 sigma last winter (moderate El Niño) to -1 sigma this fall (moderate La Niña) is unusual in its own right - only ‘64, ‘73, ‘88, and ‘98 (not shown) share this distinction, and only ‘64-65 bounced right back.
The ECMWF forecasts underestimated the speed of descent into near-neutral conditions in early 2007 (left) , but was right in anticipating an early peak of the last El Niño. It did a good job in predicting the long near-neutral phase through the summer (bottom left), and is now predicting moderately strong La Niña conditions into early 2008.
Expected Impacts of La Niña: 700mb Fall 700mb height anomalies for 12 La Niña cases: 1949, 54, 55, 56, 64, 70, 71, 73, 74, 75, 88, and 99, based on MEI (few moderate-to-strong La Niña events since ‘76). The average response to La Niña can be interpreted as a northward shift of the storm track into the Pacific Northwest (more SW’ly than W’ly flow), and increased odds of high pressure over the southwestern U.S., leading to above-normal temperatures from CA to the Midwest.
Expected Impacts of La Niña: 700mb Winter 700mb height anomalies for 12 La Niña cases: 1949-50, 1950-1, 54-5, 55-6, 56-7, 61-2, 70-1, 73-4, 75-6, 88-9, 98-9, and 99-00, based on the MEI. The average response to La Niña can be interpreted as a reduced tendency for ridging in the Western U.S., opening the door both for more storms to hit the northwestern quarter of the country, as well as more frequent incursions of arctic air, and increased preference for ridging along the Atlantic sea board.
Expected Impacts of La Niña: 700mb Spring 700mb height anomalies for 12 La Niña cases (same as for winter season): 1950, 1951, 55, 56, 57, 62, 71, 74, 76, 89, 99, and 2000, based on the MEI. The average response to La Niña can be interpreted as continued storminess over the Pacific Northwest and points east, as opposed to increased pressure over the southern U.S. The increased north-south geostrophic gradient tends to promote Chinook-like conditions to the east of the Rocky Mountain Front Range.
Expected Impacts of La Niña: Tsfc Winter temperature anomalies for 12 La Niña cases: 1949-50, 1950-1, 54-5, 55-6, 56-7, 61-2, 70-1, 73-4, 75-6, 88-9, 98-9, and 99-00, based on the MEI. The average response to La Niña has been to favor significantly warmer temperatures in the southeastern half of the country, while increased storminess (and onshore flow) in the northwestern U.S. does not necessarily result in particularly cold average temperatures.
Expected Impacts of La Niña: Tsfc Spring temperature anomalies for 12 La Niña cases (same as for winter season): 1950, 1951, 55, 56, 57, 62, 71, 74, 76, 89, 99, and 2000, based on the MEI. The average response to La Niña has been to favor warmer temperatures in the southwestern U.S. (recently enhanced by long-term warming trends), and cooler temperatures in the Pacific Northwest, due to increased storminess (being counter-balanced by recent warming trends).
Expected Impacts of La Niña: Precipitation Fall precipitation anomalies for 12 La Niña cases: 1949, 54, 55, 56, 64, 70, 71, 73, 74, 75, 88, and 99, based on MEI. Consistent with increased odds for high pressure in the southwestern U.S., there is a significant reduction in the amount of precipitation in this region. The northwestern quarter of the U.S. shows a mixed precipitation response, partially due to sub-optimal climate divisions.
Expected Impacts of La Niña: Precipitation Winter precipitation anomalies for 12 La Niña cases: 1949-50, 1950-1, 54-5, 55-6, 56-7, 61-2, 70-1, 73-4, 75-6, 88-9, 98-9, and 99-00, based on the MEI. The average response to La Niña includes reduced precipitation amounts in much of the southern tier of states, but increased precipitation in the Ohio valley and in parts of the northwestern U.S., again somewhat muddled by the climate division perspective.
Expected Impacts of La Niña: Precipitation Spring precipitation anomalies for 12 La Niña cases (same as for winter season): 1950, 1951, 55, 56, 57, 62, 71, 74, 76, 89, 99, and 2000, based on the MEI. The average response to La Niña shows decreased moisture over the southwestern U.S., as well as over the Central Plains.
Expected Impacts of La Niña: Can we do better? Do analyses down to (COOP) station level (SNOTEL just getting long enough to start doing that); Do analyses with PRISM; Do analyses with new&improved climate divisions. Instead of looking at ‘mean response’, analyze the conditional probabilities (‘risk’) of certain climate outcomes with respect to ENSO phase. Skipping over: choice of ENSO Index (‘ONI’ is sub-optimal in my opinion) influences conditional sampling.
Expected La Niña Impacts: COOP vs. SNOTEL Seven ‘La Niña’ cases since 1978 include weaker events than 12 out of 60 selection.
Expected Impacts of La Niña: PRISM Confirms wetness in PNW as well as higher elevations of CO!
Statistically derived climate divisions Why use climate divisions at all?Need forspatially averaged data is three-fold: historical assessments of the instrumental record, near-realtime monitoring, and climate predictions all profit from better climate divisions, and are not recommended at the station level for many sites (data too noisy!). Climate Divisions can be designed to statistically optimize existing observational data in terms of climatic co-variability. How much better can we get?Ballpark: at least 50% explained variance in lower 48 states with lower number of divisions (down from 344 to 139). How is this accomplished? Using multivariate statistical techniques (two types of cluster analysis, as well as rotated Principal Components), we identify so-called core regions as the cross-section results at least two techniques. These are allowed to grow/shrink by adding, dropping, or swapping member stations. Validity of new divisions is checked by comparing against precipitation-only stations, SNOTEL sites, and WY’49-’78 vs. ‘79-’06. At this point, we are drawing lines between divisions to be able to get areal coverage for each division (last hurdle before this goes to NCDC).
Statistically derived climate divisions Link: http://www.cdc.noaa.gov/people/klaus.wolter/ClimateDivisions/
Statistically derived climate divisions Regular COOP stations (circles) vs. SNOTEL (triangles) vs. precip-only (squares); red circle refers to north-central mountains of Colorado
Seasonal precipitation impacts in CO (La Niña) Seasonal precipitation amounts (in percentiles from 1950-99) for 10 La Niña cases: 1950-1, 54-5, 55-6, 56-7, 64-5, 70-1, 71-2, 73-4, 75-6, and 88-9, based on the MEI. If 8 or more cases out of 10 reside above or below the median, the distribution is shifted significantly. If 4 or more cases reside in the upper (80%) or lower (20%) quintile, there is only a 10% chance that this result is by accident. The 2005-6 La Niña “event” never ranked higher than 17th. DRY WET