Download
1 / 12
120 likes | 226 Vues
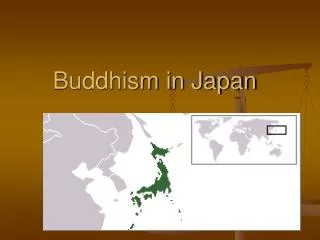
Japan in Context. (1) Spatiality, Economics & Demographics. Kayo Murakami RISE, Waseda University kayo@suou.waseda.jp. Japan in Asia. Japan. North Korea. Korea. China. Rivers&Lakes 3.5%. Roads 3.3%. Others 3.9%. ●Tokyo. Housings 4.7%. Farm Land 13.2%. Forest 66.4%. Geography.

E N D
Japan in Context (1) Spatiality, Economics & Demographics Kayo Murakami RISE, Waseda University kayo@suou.waseda.jp
Japan in Asia Japan North Korea Korea China
Rivers&Lakes 3.5% Roads 3.3% Others 3.9% ●Tokyo Housings 4.7% Farm Land 13.2% Forest 66.4% Geography • Area: 377,873 km2 • 4 major islands and 4,000 smaller islands • Coastline: 29,751km Hokkaido Honsyu Kyusyu Shikoku
↓Peak at 2005 Demography: Population Change 126,697,282 (2000 Census) Population density: 327 / km2 Urban Population: 77% 1920 1940 1960 1980 2000
Demography: Age Structure (2000) • Life Expectancy at Birth (2005) • 81.15 year-old • (Male: 77.86, Female: 84.61) • Total Fertility Rate (2005) • 1.39 Children born / woman Male Female
Demography: Age Structural Change 1930 2000 2050 Estimated male female Source: National Institute of Population and Social Security Research
2004 Gross Domestic Expenditure (=GDP) : 532 trillion Yen (Source: Cabinet Office) Economy: GDP Gross Domestic Product (at current prices converted into UD$)
Economy: Industrial Structure Employed Persons by Industry (2004) source: Statistics Bureau, MIC GDP by Industry (2003) source: Cabinet Office
Economic Trend (1) Shares of Business Establishments and Persons Employed by Scale of Operation (2004)
Economic Trend (2) Percentage of Non-regular Staff by Age Group source: Statistic Bureau, MIC Form of Employment by Sex and Age (2004) source: Statistic Bureau, MIC
Critical issues • Territorial • Concentration in Tokyo, declining regions • Demographic • ageing: longer life expectancy • declining workforce: high youth unemployment rate (NEET 520K in 2003) • depopulation: low birthrate