Download
1 / 65
650 likes | 744 Vues
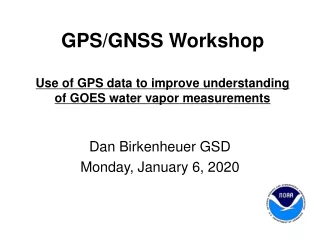
Atmospheric Water Vapor Determination from Ground GPS Data and Application to Meteorology. Angelyn Moore, Frank Webb Jet Propulsion Laboratory, California Institute of Technology Jim Means, Xiaopeng Tong, Yehuda Bock Scripps Institution of Oceanography Seth Gutman

E N D
Atmospheric Water Vapor Determination from Ground GPS Data and Application to Meteorology Angelyn Moore, Frank Webb Jet Propulsion Laboratory, California Institute of Technology Jim Means, Xiaopeng Tong, Yehuda Bock Scripps Institution of Oceanography Seth Gutman NOAA Earth Systems Research Laboratory David Danielson, Jayme Laber NOAA Los Angeles/Oxnard Weather Forecast Office Ivory Small NOAA San Diego Weather Forecast Office
Background Under NASA REASoN and MEaSUREs projects, JPL and SIO have for 6+ years independently analyzed 1200+ western U.S. GPS sites. The GPS Explorer portal provides access to the results.
Background SIO uses GAMIT software; JPL uses GIPSY. The 2 time series are rigorously combined, and analyzed to give 15+ year daily time series for the longest lived sites. The portal allows the user to explore the time series and perform custom modeling.
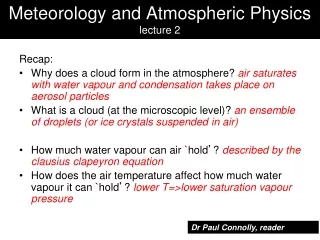
PrecipitableWater from GPS Δttotal= Δtgeom + Δtiono + Δttrop + … Zenith hydrostatic delay = f(surface pressure) Zenith wet delay In solving for this, we estimate this TD(θ) = ZHDmh(θ) + ZWDmw(θ) 2 km 7° Mapping functions PW = κ × ZWD 1/κ = 10-6 × ρRv[(k3/Tm) + k2’] ≈ 6.5 32 km Mean atmos temp ≈ 70.2 + 0.72Ts With a surface pressure and a surface temperature, we get to PWV from ZTD. Total trop delay
Comparison with WVR, RAOBS Credit: R. Ichikawa, National Institute of Information and Communications (Japan)
State of the Art in Southern California • Coverage – see below • Excellent temporal resolution (1 hr to 5 min) • Timeliness – daily to hourly • Co-located meteorological instruments are few
January 11, 2005 Troposphere Behavior After 3.5 days of continuous rain, the weather cleared on Jan 11 Jan 10 was La Conchita landslide
January 19, 2005 – Quieter atmosphere Jan 11 Jan 19
Monsoon Progression in California Pre-monsoon Monsoon onset Peak monsoon August 1, 2007 21Z July 13, 2007 06Z July 14, 2007 00Z