Download
1 / 29
290 likes | 418 Vues
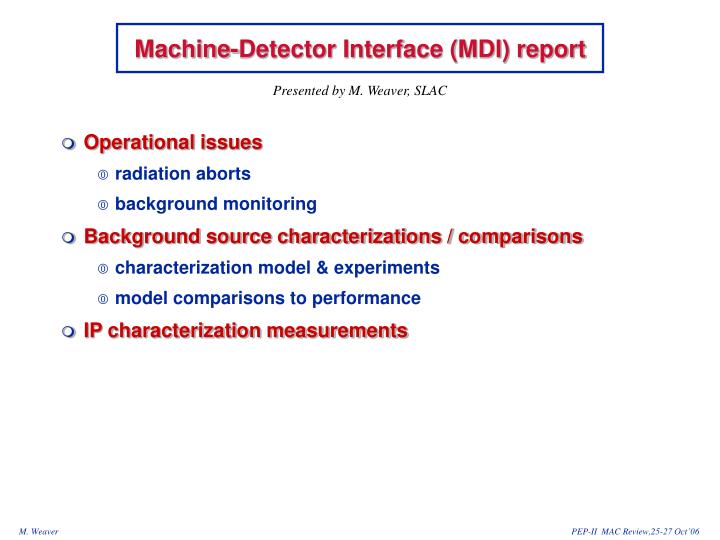
Machine-Detector Interface (MDI) report. Presented by M. Weaver, SLAC. Operational issues radiation aborts background monitoring Background source characterizations / comparisons characterization model & experiments model comparisons to performance IP characterization measurements.

E N D
Machine-Detector Interface (MDI) report Presented by M. Weaver, SLAC • Operational issues • radiation aborts • background monitoring • Background source characterizations / comparisons • characterization model & experiments • model comparisons to performance • IP characterization measurements
B. Petersen S. Curry Run-5 radiation-abort history <stable-beam trips> ~ 1.3/day (Run5a), 3.2/day (Run5b) Apr 2005 Jul 2005 Oct 2005 Jan 2006 Apr 2006 Jul 2006 Oct 2006
Jan 2006 Jan 2006 Apr 2005 Apr 2005 Jul 2005 Jul 2005 Oct 2005 Oct 2005 Apr 2006 Apr 2006 Jul 2006 Jul 2006 Oct 2006 Oct 2006 Abort-by-dose location Forward West Forward East Forward Q1/Q2 bellows HER arc bellows Backward West Backward East
Background Monitoring Summary • SVTRAD diodes + diamonds dose rates, dose / injection • DCH high voltage current • DRC PMTs scaler rates • IFR high voltage current • Fast Control & Timing deadtime, L1 rates, time wrt injection, assoc to bunch in train • Level 3 Trigger subdetector occupancies • Neutron counters scaler rates • CsI IP detectors (logarithmic response) • All update in small intervals (1-5 seconds)
Run-5 radiation-dose rates BE Diamond BW Diamond Dose rate (mrad/s) Dose rate (mrad/s) Incoming LER Vacuum Incoming HER Vacuum Pressure (nT) Pressure (nT)
Injection- & trickle- background history Monitor by integrating SVTRAD diode signals over 12 ms after each injection SVT electronics are sometimes “upset” by exposures greater than 50 mrad / injection. LER injection-quality monitor HER injection-quality monitor Average Dose/Injection (mrad) Average Dose/Injection (mrad)
Injection- & trickle- background history Monitor using triggers gated around the passing of the injected bunch (1 ms x 15 ms) Injection contaminates the BaBar physics data sample if backgrounds endure too long HER injection-quality monitor LER injection-quality monitor Triggers/Injection Triggers/Injection
DIRC PMT Scaler Rate DIRC reconstruction has been shown to be robust well above 1MHz hit rate.
Largely due to radiation damage in this region Detector Occupancies (%) noise level during cosmics SVT Layer 1 West SVT Layer 1 East Not so high, but already some track losses due to non-robust algorithms Better luminosity Lower occupancy EMC Total DCH Total
Background sources in PEP-II • Synchrotron radiation (this bkg negligible in PEP-II, but not in KEKB) • Beam-gas (bremsstrahlung + Coulomb) • HEB only: BHbg ~ IH * (pH0 + PHDyn * IH) Note: p0 = f(T) ! • LEB only: BLbg ~ IL * (pL0 + PLDyn * IL) Note: p0 = f(T) ! • beam-gas x- term: BLHbg ~ cLH * IL * IH (LEB+HEB, out of collision) (?) • Luminosity (radiative-Bhabha debris) – major concern as L • BP ~ dP * L (strictly linear with L) • Beam-beam tails • from LER tails: BL, bb ~ IL * fL(xL,H+/-) • from HER tails: BH, bb ~ IH * fH(xL,H+/-) • Trickle background: BLi ,BHi(injected-beam quality/orbit + beam-beam) • Touschek: BLT(signature somewhat similar to bremstrahlung; so far small)
Background model comparisons(measured/model) Bwd East Dose Rate Bwd West Dose Rate low current running Higher than predicted, but LER backgrounds are a small absolute contribution to any subdetector. • Lower than predicted : • HER vacuum better than Jan’04 • perhaps some dynamic pressure evident.
Background model comparisons(measured/model) DCH Background L1 Trigger Rate Also lower than predicted. Late Run5 tuning brought backgrounds down below predictions; nice, but inconsistent with our model.
Background model comparisons(measured/model) DRC Background Large fluctuations but quite tolerable in this subdetector.
Beam-beam background extrapolation • A beam-beam background term produced only small contributions to Jan’04 characterization models. Still, we prepare for a possibly large background source. • Inspired by simulation, a downstream LER collimator was added during Run5 A->B downtime. The collimator proved to be a generator of HOMs in a region plagued by overheating, so it was removed mid Run5B. It will be returned with HOM absorbers after the heat sensitive elements are upgraded. • Before it’s removal a high bunch current experiment attempted to test its effectiveness, but high bunch currents could not be achieved (lifetime problems). • Results from the last high bunch current experiment of Run5 …
Bunch Current Extrapolation Experiment Luminosity Luminosity Specific Luminosity 1030 /cm2/s 1030 bunch/cm2/s/mA2 Running with half the number of bunches
SVT Dose Rates Bwd East Dose Rate Bwd West Dose Rate Rad/s Rad/s our background model
DCH & Trigger DCH HV Current L1 Trigger Rate Hz mA our background model Initially 30% below estimate consistent with late Run5 tuning. Runaway HER backgrounds appear here but settled to a reasonable level. Similar behavior.
Latest experiment indicates HER losses may be a source of background from beam-beam, but tuning to control backgrounds should be effective. • The future looks promising. • Perhaps the experiment was too clean because of lack of parasitic collisions.
IP Characterization • Use BaBar’s tracking resolution and prime venue for measuring important parameters at the IP • Three analyses each measuring ey, b*y • dLumi / dz vertexing e+e- and m+m- events • syLumi(z) m+m- events • sy’Lumi(z) m+m- events e- beam (resolution) Production vertices (x,y,z ~ 30mm) Boost trajectories (q ~ 0.6 mrad) e+ beam
BaBar IP measurements reported online • Luminous Region • centroids { x, y, z} • sizes { x, z } every 10 minutes • tilts { dx/dz, dy/dz } • dL/dz fit { Sz, b*y, zw, zc} every ~hour • Boost Trajectory • mean { x’, y’ } every 10 minutes • spread { x’HER, y’HER } every 30 minutes Improved reliability by integrating detector alignment calibration into the online analysis. }
IP Beta Function Measurements dL /dz syL PEP phase advance b2 sy’B
Putting X & Y Together Sx calculated from boost y measurements and Lsp Lumi-region x-size measurement Ratio of horizontal beam sizes (larger/smaller) Physical lower bound
IP Beta Function Measurements (cont.) BaBar measurements are systematicly larger than PEP measurements. Best candidate explanations: 1) Consideration of x-y coupling in the rings – the effect has the correct scale – we are correlating with PEP coupling msmts – we are developing IP coupling msmts with BaBar 2) Effect of orbit differences in/out of collision – PEP investigating
European Particle Accelerator Conference ’06 Submissions B.Viaud, W.Kozanecki, C.O'Grady, J.Thompson, M.Weaver, Monitoring of Interaction-point Parameters Using the Three-dimensional Luminosity Distribution Measured at PEP-II. M.Weaver, W.Kozanecki, Characterization of the PEP-II Colliding-beam Phase Space by the Boost Method. A.Bevan, W.Kozanecki, B.Viaud, A.Fisher, C.O'Grady, J.Thompson, M.Weaver, Combined Phase Space Characterization at the PEP-II IP using Single-beam and Luminous-region Measurements.
Summary (I) • Two prolonged episodes of radiation aborts due to vacuum bursts / arcs in failing accelerator components. • Injection backgrounds continue to be under control • Stored-beam bgds (dose rate, data quality, dead time) • Better than expected • Also no new (stable) thermal outgassing/vacuum activity. • Background characterization • No new experiments. Plan for early Run6 once machine recovers performance. • Latest measures of the projected backgrounds look good – would impact detector remediation/upgrades with long lead times • Anticipated large beam-beam backgrounds, but latest experiment suggests not.
Summary (II) • BaBar-based IP characterization • Still struggling to understand systematic differences • Incorporating effects of coupling and developing possible measurements • Working on including X-ray and SL beam profile monitors
August 7 Background Improvements Jan’04 Extrapolation 2-Beam HER LER