Download
1 / 28
280 likes | 442 Vues
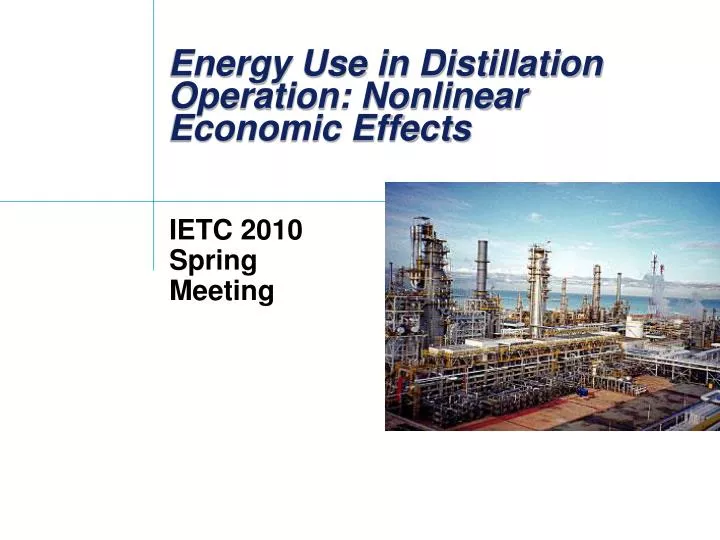
Energy Use in Distillation Operation: Nonlinear Economic Effects. IETC 2010 Spring Meeting. Presenter. Doug White Principal Consultant PlantWeb Solutions Group Emerson Process Management Houston, Texas. Distillation Energy Impact.

E N D
Energy Use in Distillation Operation: Nonlinear Economic Effects IETC 2010 SpringMeeting
Presenter Doug White Principal Consultant PlantWeb Solutions Group Emerson Process Management Houston, Texas
Distillation Energy Impact • Over 40000 distillation/ fractionation columns in the US alone • Consume 40% - 60% of the total energy used in chemical and refining plants • Consume 19% of the total energy used in manufacturing plants in the US Reference: Office of Industrial Technology:Energy Efficiency and Renewable Energy;US Department of EnergyWashington, DC“Distillation Column Modeling Tools”
Presentation Objectives • Present general approaches to saving energy in fractionation/ distillation through improved control • Present techniques for economic analysis that recognize non-linear character of distillation operation and effects of product blending
Typical Distillation Column PC CW Gas FC LC FC Feed, F Reflux,R Distillate, D AR TC Steam FC LC Reboiler,E Bottoms, B AC
Traditional Control Benefit Analysis Specification Limit ProductComposition($/ DayProfit) Operating Targets Improved Profit By Changing Target Better Control, ReducedVariability Poor Control Time When is this valid? When is it not?
Representation of Variability Gaussian Distribution Specification Limit Mean Frequency of Occurrence ProductComposition Time Composition
Effect of Variability – Linear Objective Function Expected Values ValuationFunction Move AverageCloser ToLimit ToIncreaseValue Product Value;$/ Day Limit ProjectedDistribution OriginalDistribution Composition No Benefit For Better Control At Constant Setpoint!
Case Study – Debutanizer Column PC FC LC Distillate, D< 3%C5 ;$60/ Bbl>3%C5; $40/ Bbl FC Feed, F20,000 BPD$60/ Bbl Reflux,R AR C3 – 25%nC4 – 25% nC5 – 25%nC6 – 25% TC Steam FC 15$/MMBTU LC Reboiler,E Bottoms, B<5%C4; $80/ Bbl> 5%C4; $60/ Bbl AC
Case Study – Typical Tiered Pricing With Composition < 3%C5; $60/ Bbl On - Spec Product Off - Spec Product >3%C5; $40/ Bbl On - Spec Product < 5%C4; $80/ Bbl Off - Spec Product > 5%C4; $60/ Bbl
Operating Margin – Bottoms Compositional Change – Constant Reflux – No Control Variability Top ProductOn Spec Bottom ProductOff Spec
Operating Margin – Control Variability Impact – Base Case Initial Mean Value Spec Initial Operating Target Initial Variability
Operating Margin – Improved Control – Reduced Variability Case NewMean Value IncreasedMargin Spec ImprovedControlYields ValueAt ConstantSetpoint! Same Operating Target NewVariability
Operating Margin – Optimum Target Composition Versus Control Performance Std Dev Optimum Setpoint 0.0 0.1 0.2 Optimum Target For CompositionVaries with Control Performance and is NOT at the limit! 0.3 0.4
Distillation – Energy and Margin Product Value,$/day High Energy Cost, $/day Operating Margin, $/ Day Low Energy Cost, $/day Low Energy Cost Margin $/day High Energy Cost Margin$/day Low Energy Cost Optimum Min Reflux High PuritySpecifications High Energy Cost Optimum Reflux/Reboiler
Energy Cost versus Reflux Change – Constant Bottom Composition
Operating Margin – Optimum with Varying Energy Pricing Top Product Specification Limit Control Target Changes from Composition To Reflux (Energy) Depending on Relative Prices
Energy Cost ExpectedValue Probability Distribution More Pure Composition Less Pure Non-Linear Objective Functions – Impact of Variability For nonlinear relationship, the expected value of the energy cost is NOT at the value equivalent to the median of the composition; It’s value depends on the standard deviation of the composition
Energy Cost – Effect of Control Variability Initial Mean Value NewMean Value ReducedEnergy Initial Variability NewVariability
Column Product Shipped Product Effect of Blending Proposition: Since actual specification is on shipped product rather than column product directly, small excursions over the specification don’t matter and can be handled by blending.Is this correct?
Energy Cost – Impact of Control Performance Better ControlPerformancePays Even With Blending
Energy Cost – Operating Pressure Impact – Constant Top and Bottom Product Compositions
High Purity Columns Often Have Non- Symmetric Compositional Distributions. Aromatics Column Data Data Gumbel Gaussian Gumbel is a twoparameter statisticaldistribution which often fits non-symmetric data well
Summary – Distillation Economics - Conclusions • For practical cases with tiered product pricing the optimum composition target may not be at the maximum impurity limit • The optimum energy usage depends on energy pricing and may be shift from constrained to unconstrained • Even with product blending there is an incentive for better control performance • Minimizing pressure continues to have value for many separations • High purity columns often have non-symmetric compositional distributions – require special statistical analysis beyond Gaussian distribution assumptions