Download
1 / 22
220 likes | 355 Vues
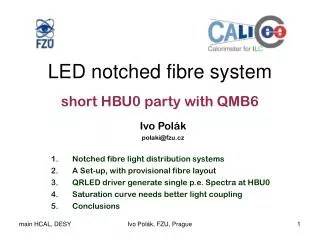
Tests of the fiber-based calibration system CALICE collaboration meeting Cambridge, UK 2012/9/18 Jaroslav Zalesak Institute of Physics, Prague. QMB1 LED driver and notched fiber system Single photon spectra & gain performance Amplitude scan and saturation achievement. QMB1 .

E N D
Tests of the fiber-based calibration system CALICE collaboration meeting Cambridge, UK 2012/9/18Jaroslav ZalesakInstitute of Physics, Prague QMB1 LED driver and notched fiber system Single photon spectra & gain performance Amplitude scan and saturation achievement
QMB1 More info on QMB can be found: http://www-hep2.fzu.cz/calice/files/20110915-Polak_I.CALICE_Heidelberg.pdf • Quasi resonant Main Board • Modular system, 1 LED per board • Operation mode: • DAQ + CAN bus control • stand-alone mode • LVDS Trigger distribution system • Variable amplitude, zero to maximum (~1Amp) smooth • Pulse width fixed to ~ 3.5ns (UV or blue LED) • Voltages and temperature monitoring • Size of PCB: width 30mm, depth 140mm Single power 15V, 65mA Ivo Polák, FZU, Prague
2nd Test @ DESY (May 2012) • 2 times HBU2, in one row, each had • two activeSPIRoc2b ASICs, • equipped with 3 rows of scintillators & SiPMs • Different tiles & SiPMs on each HBU2 (‘Old’ and ‘New’ HBU) • Tests at DESY 2012, May 21 & 27 • Low & High Gain running • Analysis mainly done by JiříKvasnička • Single photon electron spectra • Fast Fourier Transform of p.e. spectra to get the peak distance • Linearity & Amplitude scan • Thanks to Mathias Reinecke for effort to set up the 2ndHBU2 CALICE, Cambridge, Sep 18, 2012
Test setup with 2 HBUs • 3 QMB1 drivers • 3 UV LEDs • 3 notched fibers • Each 24 shining points • 72 active channels in total • 4 active Spiroc2b ASICs in r/o (#129,130,131,132) • @ 2 HBU2s • approx 1/3 of final idea: • 3 notched fiber per 1 LED • Each fiber for 24 tiles CALICE, Cambridge, Sep 18, 2012
High Gain p.e.spectra CALICE, Cambridge, Sep 18, 2012
SPS: FFT vsMultiGauss Thanks to Oskar Hartbrich • Single peak distance measurement • Performing FFT & Gaussian fit to spectrum • MultiGuass fit is more accurate (2x lower fit errors) • FFT overshoots gain distribution mean by 1-3% • Advantage: powerful with very low statistic CALICE, Cambridge, Sep 18, 2012
Pixel Gain in HG mode ASIC 0 ASIC 3 ASIC 2 ASIC 1 HBU OLD HBU NEW • Pedestal shift occurred, probably issue of SpiRoc2b ASIC chips, new ASICs should cure this problem • Some pathological cases (no holes, impossible fixing, no tile) for few channels • Differences of ‘old’ and ‘new’ tile-sipm batches are visible • ITEP: LY of tile & SiPM 15 vs. 12 pix./MIP • Gain 2.0 vs. 1.5 M, Ubias 43V vs. 47V (not good working point, delay setup) • Physical number of pixels should be same • In average ~3 times higher pixel gain, assuming same light intensity from notches CALICE, Cambridge, Sep 18, 2012
Optical performance (HG) • row/fiber #1 • row/fiber #2 • row/fiber #3 • Same light intensity input, study homogeneity of light coming from notches • 2 times higher response for ‘new’ HBU2 in units of pixels • 1st fiber the best, (omitting point#8) light inhomogeneity within 18%, average variation 6%, even better after correction LG/HG modes • 2nd fiber still ok, 3rd problematic due to fiber routing & fixing CALICE, Cambridge, Sep 18, 2012
Saturation curves: procedure Pedestal subtraction ADC bins/V1 Pixels/energy Pixels/V1 CALICE, Cambridge, Sep 18, 2012
Saturation curves: All rows • Response variation for fibers • 1st (outermost) best • 2nd some problem with resetting of card slow control • 3rd problems with fiber routing, misalignment of fiber notch and holes in HBU PCB CALICE, Cambridge, Sep 18, 2012
Saturation curves: All HBUs • scaling factor HG/LG ~40 • OLD HBU: asics A2 and A3 • Performance of ‘OLD’ HBU card much worse, no saturation reached CALICE, Cambridge, Sep 18, 2012
Conclusion • Fiber-based calibration system tested in May at DESY • 3 QMB1 with 3 LED & 24-notch fibers routed on PCB • Two HBUs connected in one row provided • Unfortunately not the same performance of tile – SiPM setup • Common characteristics measured: HG, LG, amplitude scan • FFT is successfully applied on p.e. spectra to extract SiPM gain • Wide range of light intensities provided • Proper fiber routing allowed to achieve saturation limits • QMB1 is in full operational stage • Homogeneity of 24-notch fibers looks reasonable • Upgrade of QMB1(v2.0) is foreseen in end of 2012 CALICE, Cambridge, Sep 18, 2012
BackUp CALICE, Cambridge, Sep 18, 2012
Frame with 5 (and 1 spare) QMB1 Ivo Polák, FZU, Prague
Principal schema Larger inductor than the older QMB6 Ivo Polák, FZU, Prague
TRIGGER (T-calib) LVDS distribution to QMB1 master slave slave slave slave TX RX Terminated 120ohm Terminated 120ohm LVDS Up to 6 + 6 slaves modules Trigger from DAQ Ivo Polák, FZU, Prague
DESY test setup in November HBU2 SPIROC2 Notched fibres Single layer frame PWR 15V DIF, PWR, CAL QMB1 QMB1 QMB1 QMB1 combiner CANbus T-calib from DAQ Ivo Polák, FZU, Prague
QMB1 (1-chanel LED driver): Done Topology, PCB design Communicating bus (CAN) CPU (Atmel AVR) Trigger distribution (LVDS) Trigger delay canbe tuned by C trimmer (~10ns) 4 mounting holes for screw M2.5 Fibre(LED) position set to center of PCB PCB in production + assembly To be done Debugging in October/beginning of Nov Set of notched fibers, semiautomat machine under development Set: 3*fibre with 24 notches, creating a line of 72 notches. 3 sets will be delivered in November work at 2011 2010 Idea Ivo Polák, FZU, Prague
Saturation curves: procedure CALICE, Cambridge, Sep 18, 2012
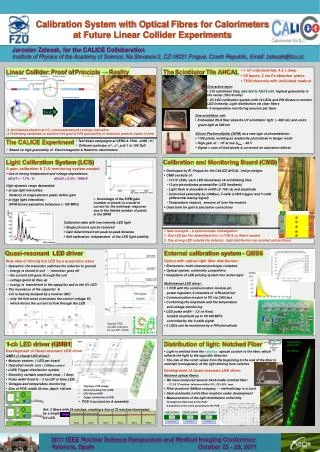
Distribution of light:Notched Fiber Iluminated by Green laser 24 notches • Light is emitted from the notches • The notchis a special scratch to the fiber, which reflects the light to the opposite direction • The size of the notch varies from the beginning to the end of the fiber to maintain homogeneity of the light, which comes from notches Emission from the fiber (side view) First notch Middle notch End position notch Ivo Polák, FZU, Prague
Notched fibresSemi-automatic tool Now in operational debugging & sw development stage Alu/PCB Template with moving scint tile Frame with x-y stepper motors Drill machine used as milling cutter to groove the notch PCB with 3mm holes Scintilator tile w SiPM Ivo Polák, FZU, Prague
QMB1 linearity, amplitude scan Standard LED pulses 3ns, PWR measured by optical power meter ThorLabsPM100D Differential Nonlinearity Ivo Polák, FZU, Prague