Download
1 / 19
190 likes | 290 Vues
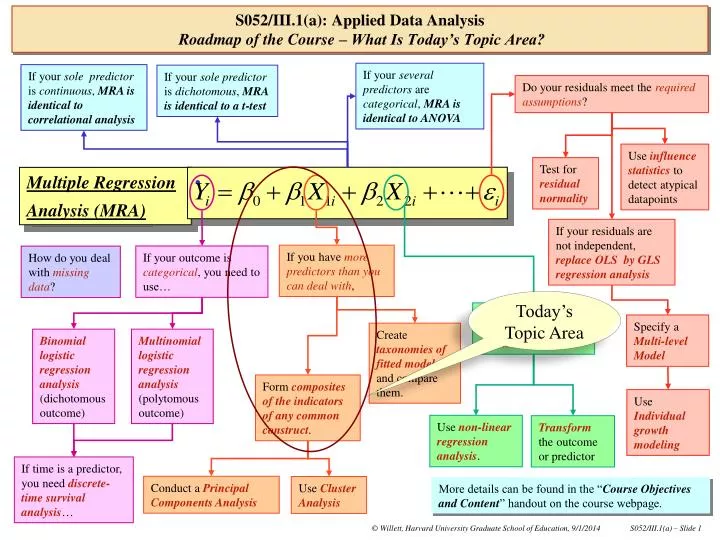
If your several predictors are categorical , MRA is identical to ANOVA. If your sole predictor is continuous , MRA is identical to correlational analysis. If your sole predictor is dichotomous , MRA is identical to a t-test. Do your residuals meet the required assumptions ?.

E N D
If your several predictors are categorical, MRA is identical to ANOVA If your sole predictor is continuous, MRA is identical to correlational analysis If your solepredictor is dichotomous, MRA is identical to a t-test Do your residuals meet the required assumptions? Use influence statistics to detect atypical datapoints Test for residual normality Multiple Regression Analysis (MRA) If your residuals are not independent, replace OLS byGLS regression analysis If you have more predictors than you can deal with, If your outcome is categorical, you need to use… How do you deal with missing data? Today’s Topic Area • If your outcome vs. predictor relationship isnon-linear, Specify a Multi-level Model Create taxonomies of fitted models and compare them. Binomiallogistic regression analysis (dichotomous outcome) Multinomial logistic regression analysis (polytomous outcome) Form composites of the indicators of any common construct. Use Individual growth modeling Use non-linear regression analysis. Transform the outcome or predictor If time is a predictor, you need discrete-time survival analysis… Conduct a Principal Components Analysis Use Cluster Analysis More details can be found in the “Course Objectives and Content” handout on the course webpage. S052/III.1(a):Applied Data AnalysisRoadmap of the Course – What Is Today’s Topic Area?
Today, in Syllabus Section III.1(a), onClassical Methods For Compositing Multiple Indicators Of A Construct, I will: • Explore issues in forming composites from multiple indicators (#3 - #5). • Comment on the role of indicator variability & indicator-indicator correlation in composite formation (#6 - #10). • Review fundamental tenets of classical test theory and define the reliability parameter (#11 - #12). • Show how reliability depends on the number of indicators included in the composite (#13). • Estimate and interpret the internal consistency reliability of a group of indicators, using Cronbach’s (#14 - #16). • Demonstrate how estimates of Cronbach’s can be used to conduct simple item-analyses of the indicators within a composite (#17 - #18). • Appendix 1: Listwise vs. pairwise deletion (#19). Please check inter-connections among the Roadmap, the Daily Topic Area, the Printed Syllabus, and the content of today’s class when you pre-read the day’s materials. S052/III.1(a):Classical Methods For Compositing Multiple Indicators Of A ConstructPrinted Syllabus – What Is Today’s Topic?
A dataset in which the investigators measured multiple indicators of what they thought was a single underlying construct that represented Teacher Job Satisfaction: • The data described in TSUCCESS_info.pdf. S052/III.1(a):Classical Methods For Compositing Multiple Indicators Of A Construct Introducing the TSUCCESS Dataset
As is typical of many datasets, TSUCCESS contains: • Several variables – or “indicators” – that record teacher’s responses to survey items. • These multiple items were included in the survey instrument tp provide teachers with replicate opportunities to report their job satisfaction (“teacher job satisfaction” being the central “construct” in the research). To incorporate the multiple indicators successfully into subsequent analysis – whether as outcome or predictor – you must deal with several issues: • Should each of the indicators be treated as a separate variable in subsequent analyses, or should the indicators be combined to form a “composite” measure of the underlying construct of teacher job satisfaction? • If you form a composite, how do you confirm that the multiple indicators actually “belong together” in a single composite? • If the multiple indicators do indeed belong together in a single composite, what’s the best way to form that composite? S052/III.1(a):Classical Methods For Compositing Multiple Indicators Of A Construct Multiple Indicators of the Construct of Teacher Job Satisfaction Are Present
Different indicators have scales of different “length”: • Indicators X1, X2, X4, & X5 are measured on 6-point scales. • Indicators X3 & X6 are measured on 4-point scales. • Does this matter, and how do we deal with it in the compositing process? • Is there a “preferred” scale length? • Some indicators “point” in a “positive” direction and some in a “negative” direction: • Notice the coding direction of X4, compared to the directions of the rest of the indicators. • When we composite the indicators, what should we do about this? • Simply coding indicators on the “same” scale does not necessarily mean that they have the same “value” at the same scale points: • Compare scale point “3” for indicators X3 and X6, for instance. • How do we deal with this, in compositing? Of course, not all indicators are always created equally … S052/III.1(a):Classical Methods For Compositing Multiple Indicators Of A Construct Some Potentially Serious Problems With The Indicators Are Immediately Obvious!!!
Standard data input statements Standard formatting of indicators Here’s some preliminary analyses of the multiple indicators of teacher satisfaction. in Data-Analytic Handout III,1(a).1… *-----------------------------------------------------------------------* Input the dataset, name & label six indicators of teacher satisfaction *-----------------------------------------------------------------------*; DATA TSUCCESS; INFILE 'C:\DATA\S052\TSUCCESS.txt'; INPUT X1-X6; LABEL X1 = 'Have high standards of teaching' X2 = 'Continually learning on job' X3 = 'Successful in educating students' X4 = 'Waste of time to do best as teacher' X5 = 'Look forward to working at school' X6 = 'Time satisfied with job'; PROC FORMAT; VALUE AFMT 1='Strongly disagree' 2='Disagree' 3='Slightly disagree' 4='Slightly agree' 5='Agree' 6='Strongly agree'; VALUE BFMT 1='Strongly agree' 2='Agree' 3='Slightly agree' 4='Slightly disagree' 5='Disagree' 6='Strongly disagree'; VALUE CFMT 1='Not successful' 2='Somewhat successful' 3='Successful' 4='Very Successful'; VALUE DFMT 1=‘Never' 2=‘Almost never' 3=‘Sometimes' 4='Always'; S052/III.1(a):Classical Methods For Compositing Multiple Indicators Of A Construct Other Issues Are More Subtle, And Require Some EDA For Their Detection
Print out a few cases for inspection Examine univariate descriptive statistics on each indicator Examine bivariate inter-relationships among the multiple indicators Missing values in the indicators are always a problem, when you are forming composites. There are many ways to deal with them: • Pairwise & listwise deletion, • Mean substitution • Regression imputation, • Hotdecking, • Multiple imputation … Obtain some univariate and bivariate descriptive statistics on the indicators … *------------------------------------------------------------------* Print out 40 cases from the dataset, for inspection. *------------------------------------------------------------------*; PROC PRINT DATA=TSUCCESS(OBS=35); VAR X1-X6; *------------------------------------------------------------------* Estimate selected univariate summary statistics for each indicator *------------------------------------------------------------------*; PROC TABULATE DATA=TSUCCESS; VAR X1-X6; TABLE (X1 X2 X3 X4 X5 X6),(N NMISS MEAN VAR); *------------------------------------------------------------------* Summarize bivariate relationships among indicators of satisfaction *------------------------------------------------------------------*; * With pairwise deletion of cases with missing values; PROC CORR NOPROB NOSIMPLE DATA=TSUCCESS; VAR X1-X6; * With listwise deletion of cases with missing values; PROC CORR NOPROB NOSIMPLE NOMISS DATA=TSUCCESS; VAR X1-X6; S052/III.1(a):Classical Methods For Compositing Multiple Indicators Of A Construct Other Issues Are More Subtle, And Require Some EDA For Their Detection
More importantly, different indicators have markedly different variances: • This is a big problem when forming composites. • Because indicators withlarger varianceplay alarger rolein thecomposite score. Not unexpectedly, different indicators have different sample means Notice the impact of the missing values: • Sample size differs from indicator to indicator. „ƒƒƒƒƒƒƒƒƒƒƒƒƒƒƒƒƒ…ƒƒƒƒƒƒƒƒƒƒƒƒ…ƒƒƒƒƒƒƒƒƒƒƒƒ…ƒƒƒƒƒƒƒƒƒƒƒƒ…ƒƒƒƒƒƒƒƒƒƒƒƒ† ‚‚ N ‚ NMiss ‚ Mean ‚ Var ‚ ‡ƒƒƒƒƒƒƒƒƒƒƒƒƒƒƒƒƒˆƒƒƒƒƒƒƒƒƒƒƒƒˆƒƒƒƒƒƒƒƒƒƒƒƒˆƒƒƒƒƒƒƒƒƒƒƒƒˆƒƒƒƒƒƒƒƒƒƒƒƒ‰ ‚Have high ‚‚‚‚‚ ‚standards of ‚‚‚‚‚ ‚teaching ‚ 5097.00 ‚ 173.00 ‚ 4.33 ‚ 1.19 ‚ ‡ƒƒƒƒƒƒƒƒƒƒƒƒƒƒƒƒƒˆƒƒƒƒƒƒƒƒƒƒƒƒˆƒƒƒƒƒƒƒƒƒƒƒƒˆƒƒƒƒƒƒƒƒƒƒƒƒˆƒƒƒƒƒƒƒƒƒƒƒƒ‰ ‚Continually ‚‚‚‚‚ ‚learning on job ‚ 5109.00 ‚ 161.00 ‚ 3.87 ‚ 1.56 ‚ ‡ƒƒƒƒƒƒƒƒƒƒƒƒƒƒƒƒƒˆƒƒƒƒƒƒƒƒƒƒƒƒˆƒƒƒƒƒƒƒƒƒƒƒƒˆƒƒƒƒƒƒƒƒƒƒƒƒˆƒƒƒƒƒƒƒƒƒƒƒƒ‰ ‚Successful in ‚‚‚‚‚ ‚educating ‚‚‚‚‚ ‚students ‚ 5144.00 ‚ 126.00 ‚ 3.15 ‚ 0.45 ‚ ‡ƒƒƒƒƒƒƒƒƒƒƒƒƒƒƒƒƒˆƒƒƒƒƒƒƒƒƒƒƒƒˆƒƒƒƒƒƒƒƒƒƒƒƒˆƒƒƒƒƒƒƒƒƒƒƒƒˆƒƒƒƒƒƒƒƒƒƒƒƒ‰ ‚Waste of time to ‚‚‚‚‚ ‚do best as ‚‚‚‚‚ ‚teacher ‚ 5121.00 ‚ 149.00 ‚ 4.22 ‚ 2.79 ‚ ‡ƒƒƒƒƒƒƒƒƒƒƒƒƒƒƒƒƒˆƒƒƒƒƒƒƒƒƒƒƒƒˆƒƒƒƒƒƒƒƒƒƒƒƒˆƒƒƒƒƒƒƒƒƒƒƒƒˆƒƒƒƒƒƒƒƒƒƒƒƒ‰ ‚Look forward to ‚‚‚‚‚ ‚working at school‚ 5116.00 ‚ 154.00 ‚ 4.42 ‚ 1.78 ‚ ‡ƒƒƒƒƒƒƒƒƒƒƒƒƒƒƒƒƒˆƒƒƒƒƒƒƒƒƒƒƒƒˆƒƒƒƒƒƒƒƒƒƒƒƒˆƒƒƒƒƒƒƒƒƒƒƒƒˆƒƒƒƒƒƒƒƒƒƒƒƒ‰ ‚Time satisfied ‚‚‚‚‚ ‚with job ‚ 5125.00 ‚ 145.00 ‚ 2.84 ‚ 0.33 ‚ Šƒƒƒƒƒƒƒƒƒƒƒƒƒƒƒƒƒ‹ƒƒƒƒƒƒƒƒƒƒƒƒ‹ƒƒƒƒƒƒƒƒƒƒƒƒ‹ƒƒƒƒƒƒƒƒƒƒƒƒ‹ƒƒƒƒƒƒƒƒƒƒƒƒŒ S052/III.1(a):Classical Methods For Compositing Multiple Indicators Of A Construct Other Issues Are More Subtle – Each Indicator Has A Unique Variance, For Instance
Bivariate correlations estimated under pairwise deletion Bivariate correlations estimated under listwise deletion Sample inter-correlations among the indicators: • Are all positive (thankfully!), • Are of small to moderatemagnitude but differ widely (unfortunately!). To justify forming a single composite, you must be able to argue successfully that all indicators measure the same construct: • Here, generally positive inter-correlations support a “uni-dimensional” view. • But, the small & heterogeneous values of indicator inter-correlations also suggest: • Either there is considerable measurement error in each indicator, • Or that some, or all, of indicators may also measure other unrelated constructs. • This is bad news for the overall quality (reliability) of the ultimate composite. S052/III.1(a):Classical Methods For Compositing Multiple Indicators Of A Construct Other Issues Are More Subtle – Each Indicator Has A Different Correlation With Other Indicators
Inter-correlated indicators are like “forces” diverging from a point. In compositing the indicators, you seek their “resultant” … recall Newton’s Parallelogram of Forces? 1.09 1.09 Putting it all together … Regard the standard deviation of the indicator as its “length”: … etc. X1 X1 X2 1.25 1.25 X2 X2 X3 X1 Regard the correlationbetweentwo indicatorsas thecosine of the anglebetween them: … etc. 0.67 1.25 1.09 56 56 80 81 • X3 0.67 … etc. S052/III.1(a):Classical Methods For Compositing Multiple Indicators Of A Construct Other Issues Are More Subtle – An Interesting Geometric Presentation Of The Problem …
Classical test theory hypothesizes that, when we measurethe value of anyconstruct, the act of measurement introduces random errors into the measurement: • At the individual level, the theory assumes that: • And so, at the group level, the theory requires that: Observed Variance True Variance Observed Variance Error Variance When composites are created to measure an underlying construct, we need a statistical criterion for judging the quality of the composite thus formed … this requires a side trip into classical test theory … S052/III.1(a):Classical Methods For Compositing Multiple Indicators Of A Construct Classical Test Theory – Introducing the Notion of Observed, True and Error Scores
T Reliability is a population parameter that describes how much of the observed variance in a measure (or composite) is actually true variance: (X)= E T = Under a “classical” approach, compositing of multiple indicators is guided by the composite’s reliability: S052/III.1(a):Classical Methods For Compositing Multiple Indicators Of A Construct Classical Test Theory – What Is Reliability? What Values Can Reliability Take? Because it is a proportion, reliabilitycan take on numerical values between0and 1: • When all the observed variance is errorvariance, reliabilityiszero. • When all the observed variance is truevariance, reliability is one. Typical ranges for reliability values include:` • .6 - .8, self-reported attitude measurement. • .8 - .9, self-penned skills measures. • >.9 – standardized achievement measures. How Is Reliability Estimated? Many methods, but all involve replicate measurement: • Parallel forms estimation, • Test/Retest estimation, • Split-halves estimation, • Internal consistency estimation, … All estimation methods are based on notion that the only reason for two indicators to be correlated is their mutual interest in revealing the same underlying true variance.
As a consequence, the reliability of a composite of I indicators, each of separate reliability , can be estimated using the Spearman-Brown Prophesy Formula: Providing that each indicator to be included in a composite is a measure of the same single underlying construct: • The moreindicators you include in a composite, the higherthe reliability of the composite will be. • Why? • Because the measurement errors in each indicator are random and will tend to cancel each other out in the composite. • This leaves any true variation in each indicator to combine and be revealed in the composite measure. = .8 S052/III.1(a):Classical Methods For Compositing Multiple Indicators Of A Construct How Does the Reliability of a Composite Depend on the Number of Indicators Combined? = .6 = .4 = .2
Requests a Cronbach’s alphaestimate of reliabilityfor a compositeof indicators X1 through X6 Computation of is correct only in complete data, or under list-wise deletion of missing values • Cronbach’s is an internal-consistency estimate of reliability: • Estimated by treating each item in the composite as a replicate measure of the underlying construct. • It’s a weighted average of the indicator-indicator correlations (actually, covariances). • Assesses the extent to which sampled teachers responded consistently across all six indicators: • If all the indicator-indicator correlations are 1, then the estimated value of is 1. • If all the indicator-indicator correlations are 0, then the estimated value of is 0. *------------------------------------------------------------------------* Estimate Cronbach's Alpha (internal consistency) reliability for a composite of all the indicators of the construct of teacher satisfaction *------------------------------------------------------------------------*; * Listwise deletion of missing values ensures correct computation of alpha; PROC CORR ALPHA NOMISS NOCORR NOSIMPLE DATA=TSUCCESS; VAR X1-X6; S052/III.1(a):Classical Methods For Compositing Multiple Indicators Of A Construct Estimating Cronbach’s Alpha – An Internal Consistency Estimate of the Reliability of A Composite
Here’s the estimated -reliabilityfora “raw” composite: • In a “raw” composite, each indicator remains in its original metric. • The composite score is formed by adding the raw scores on each indicator together: where i represents the ith teacher, X1i is the raw score of the ith teacher on the 1st indicator, and so on … Here, the estimated reliability suggests that 69.7% of the observed variance in the unstandardized composite score is true variance in teacher satisfaction: • Use this estimate of reliability if you have simply summedraw indicator scoresto form a composite. • Is this a bad idea? Yes, it is when the indicators haveheterogeneous metricsandvariabilities … The output is pretty incontrovertible, but provides two estimates of the alpha coefficient … Cronbach Coefficient Alpha Variables Alpha ƒƒƒƒƒƒƒƒƒƒƒƒƒƒƒƒƒƒƒƒƒƒƒƒƒƒƒƒ Raw 0.696594 Standardized 0.735530 S052/III.1(a):Classical Methods For Compositing Multiple Indicators Of A Construct Two Estimates of Cronbach’s Coefficient Alpha -- Unstandardized Version
Here’s the estimated -reliabilityfora “standardized” composite: • Each indicator is first standardizedto amean of 0andastandard deviation of 1: • The compositeis then formed by summing the standardized indicator scores: Here, the estimated reliability suggests that 73.6%of observed variance in the standardized compositeistrue variance in teacher satisfaction: • Use this estimate if you have formed a composite by summing standardized indicator scores. • In this composite, each indicator has an identical metric and variance, and so contributes equally to the composite When the indicators have heterogeneous metricsandvariances, it’s better to use a standardized composite … Cronbach Coefficient Alpha Variables Alpha ƒƒƒƒƒƒƒƒƒƒƒƒƒƒƒƒƒƒƒƒƒƒƒƒƒƒƒƒ Raw 0.696594 Standardized 0.735530 S052/III.1(a):Classical Methods For Compositing Multiple Indicators Of A Construct Two Estimates of Cronbach’s Coefficient Alpha -- Standardized Version
Here is the item-analysis for the composite of the sixstandardized indicators Let’s focus on this item analysis, because the original teacher satisfaction indicators hadheterogeneous metricsandvariances. Here is the item-analysis for thecomposite of the sixraw indicators. Cronbach Coefficient Alpha Variables Alpha ƒƒƒƒƒƒƒƒƒƒƒƒƒƒƒƒƒƒƒƒƒƒƒƒƒƒƒƒ Raw 0.696594 Standardized 0.735530 Cronbach Coefficient Alpha with Deleted Variable Raw Variables Standardized Variables Deleted Correlation Correlation Variable with Total Alpha with Total Alpha ƒƒƒƒƒƒƒƒƒƒƒƒƒƒƒƒƒƒƒƒƒƒƒƒƒƒƒƒƒƒƒƒƒƒƒƒƒƒƒƒƒƒƒƒƒƒƒƒƒƒƒƒƒƒƒƒƒƒƒƒƒƒƒƒƒƒƒƒƒƒƒƒ X1 0.419404 0.659181 0.400722 0.718260 X2 0.428629 0.656491 0.423916 0.711781 X3 0.392822 0.677513 0.414038 0.714550 X4 0.459576 0.665171 0.472577 0.697946 X5 0.544084 0.613596 0.573332 0.668234 X6 0.537640 0.660448 0.544912 0.676762 S052/III.1(a):Classical Methods For Compositing Multiple Indicators Of A Construct Using Cronbach’s Alpha To Conduct “Item Analysis” of the Indicators
Here is the estimated reliability of thefull composite, 0.7355 Here are the estimated reliabilities for additional composites,each with the one listed indicators deleted. Recommended data-analytic strategy: Compare the estimated reliability in the deleted condition with the overall estimated reliability. • If the estimated reliabilityis smaller after the removal of the indicator, then the indicator was needed in the composite. • If estimated reliability is greater after the removal of the indicator, then the indicator was not needed in the composite. Cronbach Coefficient Alpha Variables Alpha ƒƒƒƒƒƒƒƒƒƒƒƒƒƒƒƒƒƒƒƒƒƒƒƒƒƒƒƒ Raw 0.696594 Standardized 0.735530 Cronbach Coefficient Alpha with Deleted Variable Raw Variables Standardized Variables Deleted Correlation Correlation Variable with Total Alpha with Total Alpha ƒƒƒƒƒƒƒƒƒƒƒƒƒƒƒƒƒƒƒƒƒƒƒƒƒƒƒƒƒƒƒƒƒƒƒƒƒƒƒƒƒƒƒƒƒƒƒƒƒƒƒƒƒƒƒƒƒƒƒƒƒƒƒƒƒƒƒƒƒƒƒƒ X1 0.419404 0.659181 0.400722 0.718260 X2 0.428629 0.656491 0.423916 0.711781 X3 0.392822 0.677513 0.414038 0.714550 X4 0.459576 0.665171 0.472577 0.697946 X5 0.544084 0.613596 0.573332 0.668234 X6 0.537640 0.660448 0.544912 0.676762 S052/III.1(a):Classical Methods For Compositing Multiple Indicators Of A Construct Using Cronbach’s Alpha To Conduct “Item Analysis” of the Indicators Here’s the bivariate correlationof thescore on each indicatorwiththetotal score on the other indicators … It’s often referred to as the item-total point-biserial correlation.
Listwise deletionremoves the entire case from an analysis … • Default approach in PC-SAS. • Conservative, eliminates the most cases. • Ensures that the important positive definiteness property required of covariance and correlation matrices will continue to hold. • Can be disastrous for: • Sample size. • Sample representativeness. Pairwise deletiononly removes a case when the variable on which it is missing is involved in the analysis: • Preserves the case in the analysis whenever it can contribute information. • Can lead to the violation of the positive definiteness property of covariance and correlation matrices. • Different parts of the analysis end up with different sample sizes. • Can be disastrous for sample representativeness. Obs X1 X2 X3 X4 X5 X6 1 5 5 3 3 4 2 2 4 3 2 1 1 2 3 4 4 2 2 2 2 4 . 6 3 5 3 3 5 4 4 3 2 4 3 6 . 5 2 4 3 3 7 4 4 4 4 5 3 8 6 4 4 1 1 2 9 6 6 3 6 5 3 10 3 5 3 6 3 3 11 4 2 1 3 2 2 12 5 6 2 6 6 4 13 4 3 3 2 5 3 14 3 3 3 3 4 3 15 4 4 3 6 3 2 16 6 4 3 6 6 3 17 2 1 2 4 5 3 18 3 4 3 2 3 3 19 4 4 4 6 5 3 20 2 2 3 3 3 3 S052/III.1(a):Classical Methods For Compositing Multiple Indicators Of A Construct Appendix I: Listwise and Pairwise Deletion of Missing Values