Download
1 / 32
330 likes | 367 Vues
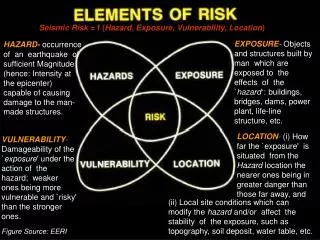
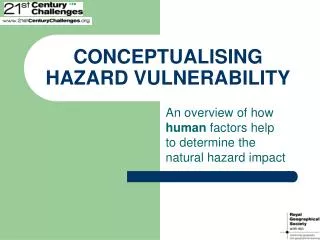
GIS Applications for Assessing Hazard Vulnerability and Risk. Robert Gottlieb ISDH Public Health Geographics IGIC Annual Meeting May 10, 2017. Hazard, Risk, and Vulnerability. Social vulnerability : Community’s susceptibility to harm from natural hazards (e.g. flood, tornado, extreme heat)

E N D
GIS Applications for Assessing Hazard Vulnerability and Risk Robert Gottlieb ISDH Public Health Geographics IGIC Annual Meeting May 10, 2017
Hazard, Risk, and Vulnerability • Social vulnerability: Community’s susceptibility to harm from natural hazards (e.g. flood, tornado, extreme heat) • Vulnerability is affected by community’s characteristics • Socioeconomic factors (e.g. poverty, age, education) • Availability of preparedness resources • Community engagement • Institutional capabilities and barriers • Risk = Hazard Exposure x Vulnerability
Vulnerability Varies Spatially • Socioeconomic conditions are different in different communities • Natural hazards are different in different parts of the country • Both factors can be quantified • Can compare relative vulnerability of different places • Different components of vulnerability may be more important in different areas • Differences in vulnerability can contribute to differences in impacts • Great opportunity to use GIS
Benefits of Vulnerability Indices • Can combine a lot of information of different types to create a simpler set of numerical scores • Can use GIS to calculate and map those scores to see which communities are more vulnerable and may need more resources and attention in preparedness, emergency response, and recovery • Helps promote disaster preparedness and mitigation and identify vulnerable areas BEFORE disaster strikes • Officials and decision makers can use indices to inform decision making
Creating Vulnerability Indices • Census/American Community Survey data is most common • This can be combined with hazard, health, infrastructure, and environment information • Some indices are applicable for all hazards, some are designed for a specific hazard • Some indices could be specific to a particular sector
American Community Survey (ACS) • Census surveys every person in U.S. every 10 years (most familiar) • Starting in 2005, the Census Bureau moved many questions from the decadal Census to ACS • ACS surveys approx. 250,000 people each month • Results are used to create 1, 3, and 5 year estimates • Only the 5 year ACS has estimates for all areas • Data is updated more frequently, but it’s a sample rather than a full count
Social Vulnerability Index (SVI) • Created by Centers for Disease Control (Flanagan et al. 2011) • Census tract level for entire U.S. • 15 Census/ACS variables • Groups variables into four categories and adds category scores together • Socioeconomic Status • Household Composition • Race/Ethnicity/Language • Housing/Transportation • Scores based on percentiles • Also flags tracts that are in the 90th percentile in each variable • All data is freely available • http://svi.cdc.gov/
SVI Calculation Each tract is ranked by percentile for each of the 15 variables, the 4 components, and overall. A tract can have a flag for each of the 15 variables, 4 components, and overall. 40 total values for each tract.
Social Vulnerability Index (SoVI) • Created by University of South Carolina’s Hazards and Vulnerability Research Institute (HVRI) (Cutter et al. 2000, 2003) • County and Census tract level for entire U.S. • 29 Census/ACS variables • Uses principal component analysis to group variables differently for each analysis, and adds component scores together • Results change depending on area and scale selected • Final scores available in ArcGIS Online and ArcGIS Pro • http://webra.cas.sc.edu/hvri/products/sovi.aspx
Vulnerability Components • Race (black) and class (poverty) • Wealth • Age (old) • Ethnicity (Hispanic) • Nursing home residents • Ethnicity (Native American) • Employment in service industries
Baseline Resilience Indicators for Communities (BRIC) • Created by HVRI (Cutter et al. 2010) • Resilience is ability to withstand harm from hazards, not exact opposite of vulnerability • 49 variables grouped into six categories ahead of time • Social • Economic • Community capital • Institutional • Housing/Infrastructural • Environmental • Large number of data sources
My Hazard Vulnerability Index • Developed for my Master’s thesis at University of Oklahoma (2011) • County level for contiguous U.S. • Combined SoVI with historical data for seven natural hazards • Tornado • Severe thunderstorm winds • Hail • Hurricane winds • Storm surge • Drought • Wildfires • Multiply SoVI and hazard score together
Vulnerability Score Hazard Score
Other Applied Index Examples • Chatham County, Georiga flood vulnerability • Heat Vulnerability Index – e.g. San Francisco, Philadelphia, Toronto Wisconsin • Predicting injuries and carbon monoxide poisoning from hurricanes in Florida • Flood and asthma vulnerability indices for Illinois
FEMA Community Resilience Indicators • https://www.fema.gov/community-resilience-indicators • 28 indicators in 10 core capabilities • Housing • Health and Social Services • Economic Recovery • Infrastructure Systems • Natural and Cultural Resources • Threats and Hazards Identification • Risk and Disaster Resilience Assessment • Planning • Community Resilience • Long-Term Vulnerability Reduction
How to Use Vulnerability Metrics • Get an understanding of vulnerability BEFORE disaster • Can identify communities that may require more attention, outreach, and investigation of more detailed processes • Help these communities raise awareness, access resources, supplement efforts of local organizations • Interviews, focus groups, workshops, studies, and plans with local organizations, leaders, and subject matter experts, can provide more insight on the needs of vulnerable areas. • Building trust and collaboration takes time • Examining individual component scores, not just the overall score, can provide additional insight • They are one of many tools – no one tool tells you everything • Indices can be starting point of larger risk and vulnerability assessments • Often can’t change the index variables directly • They do not describe processes that create vulnerability
Best Practices for Creating Indices • Use data that are up to date and available for relatively similar times • Support use of variables with documented evidence • Express variables as a percentage and standardize • A simpler process will be easy to understand, but also want index to be comprehensive • GIS can help combine data available at different scales, but need to be careful about how that is done – finer scale is preferable • Weighting variables not encouraged – how to do it? • Building indices with input from more diverse stakeholders throughout process can incorporate more perspectives and promote buy-in, but it can be more difficult to build consensus
Limitations • Scores in study area are relative, not absolute • Not all people in a geographic unit are equally vulnerable • Do not ignore areas with a low vulnerability score • Consider uncertainty in data (e.g. ACS) • Verifying vulnerability is very difficult - impacts affected by hazard severity and many other factors • Can examine health outcomes and recovery time after hazard event, but unlikely to be able to show causation – too many variables • Can’t control how people will respond • Other types of assessments and incident reports will be more useful at this stage • Local knowledge and qualitative information are also very important
National Hazard Data Source Examples • Data.gov • National Weather Service (NWS) • Storm Prediction Center (SPC) • National Hurricane Center (NHC) • National Centers for Environmental Information (NCEI) • National Drought Mitigation Center (NDMC) • Homeland Infrastructure Foundation-Level Data (HIFLD)
National Socioeconomic Datasets • U.S. Census Bureau • Decadal Census • American Community Survey • County Population Estimates • Small Area Income and Poverty Estimates (SAIPE) • Small Area Health Insurance Estimates (SAHIE) • Bureau of Labor Statistics – Employment Rate
Indiana Datasets • Midwestern Regional Climate Center • STATS Indiana • Indiana Indicators • ISDH Stats Explorer and Health Resources Directory • SAVI - Polis
Volunteered Geographic Information (VGI) • People providing content that can be mapped • A form of crowdsourcing and/or crowdmapping • In this form, data contribution, collection, and curation is not limited to experts
Citizen Science • People reporting what they observe and experience to contribute to scientific projects – related to VGI • National Severe Storm Laboratory’s mPing • Smartphone app for reporting precipitation type • Community Collaborative Rain, Hail and Snow Network (CoCoRaHS) • People measure and report precipitation amount
U.S. Geological Survey Did You Feel It? • When there is an earthquake anywhere in the world, people can go to the USGS website and report where they are and how strong the shaking was. • Helps give quick idea of how strong the earthquake was and how much damage it might have done • http://earthquake.usgs.gov/earthquakes/map/
Participatory Mapping • Allows people to create their own maps • People identify what is important to them – it may not be the same as what experts have selected • Can identify issues for which data source is not available (e.g. social connectivity) • Can make participants feel more involved and empowered within community • Responses could be drawn on a paper map and digitized
Conclusions • Vulnerability and resilience indices are one tool that can help to identify communities that susceptible to harm from natural hazards. • Introduced available datasets • Discussed best practices and limitations • Other forms of spatial information can be used to assess vulnerability and risk in more detailed applications
Thank You! Questions? rgottlieb@isdh.in.gov
References • BRACE Illinois. https://braceillinois.uic.edu/ • Cutter, S.L., J.T. Mitchell, M.S. Scott, 2000. Revealing the Vulnerability of People and Places: A Case Study of Georgetown County, South Carolina, Annals of the Association of American Geographers, 90(4): 713-737. • Cutter, S.L., B.J. Boruff, W.L. Shirley, 2003. Social Vulnerability to Environmental Hazards, Social Science Quarterly, 84(1): 242-261. • Cutter, S.L., C.G. Burton, C.T. Emrich, 2010. Disaster Resilience Indicators for Benchmarking Baseline Conditions, Journal of Homeland Security and Emergency Management, 7(1), Article 51. • Cutter, S. L., K.D. Ash, C.T. Emrich, 2014. The Geographies of Community Disaster Resilience, Global Environmental Change 29:65-77. • Dunning, C.M., S. Durden. 2011. Social Vulnerability Analysis Methods for Corps Planning. U.S. Army Corps of Engineers Campaign Plan: Goal 2. 92 pp. http://www.iwr.usace.army.mil/Portals/70/docs/iwrreports/2011-R-07.pdf • Emrich, C.T., D.P. Morath, G.C. Bowser, R. Reeves. 2014. Climate-Sensitive Hazards in Florida. Identifying and Prioritizing Threats to Build Resilience against Climate Effects. http://www.floridahealth.gov/environmental-health/climate-and-health/_documents/climate-sensitive-hazards-in-florida-final-report.pdf • Evans, J.M., M. Hauer, R.D. Hardy, J.S. Pippin. 2014. Social Vulnerability and Local Hazard Mitigation Planning: Application and Evaluation of a “SoVI-Lite” Approach for Glynn County, Georgia. https://www.researchgate.net/publication/263194584. 21 pp. • Flanagan, B., E. Gregory, E. HalliseyFlanagan, B., E. Gregory, E. Hallisey, J. Heitgerd, and B. Lewis, 2011. A Social Vulnerability Index for Disaster Management. Journal of Homeland Security and Emergency Management 8(1)., J. Heitgerd, and B. Lewis, 2011. A Social Vulnerability Index for Disaster Management. Journal of Homeland Security and Emergency Management 8(1). • Georgia Emergency Management Agency. 2014. 2014 State of Georgia Hazard Mitigation Strategy. http://www.gema.ga.gov/Mitigation/Documents/Planning/2014%20GHMS.pdf. 199 pp. • Gottlieb, R. 2011. Using GIS to Assess Vulnerability to Meteorological and Climatological Hazards in the Contiguous United States. Master’s Thesis. University of Oklahoma. 116 pp. • Weber, S. Sadoff, N., Zell, E., de Sherbinin, A. 2015. Policy-relevant indicators for mapping the vulnerability of urban populations to extreme heat events: A case study of Philadelphia. Applied Geography. 63(9): 231-243. • Wisconsin Department of Health Services. 2014. Wisconsin Heat Vulnerability Index. P-00882. 14 pp. https://www.dhs.wisconsin.gov/publications/p0/p00882.pdf • Wolf, T., W. Chuang, G. McGregor. 2015. On the Science-Policy Bridge: Do Spatial Heat Vulnerability Assessment Studies Influence Policy? International Journal of Environmental Research and Public Health. 12(10): 13321-13349.