Download
1 / 21
220 likes | 658 Vues
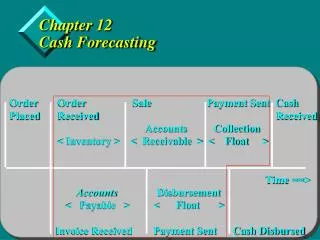
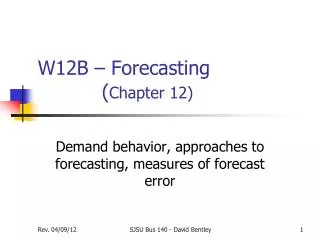
Chapter 12 - Forecasting. Forecasting is important in the business decision-making process in which a current choice or decision has future implications: Routine decisions very near in the future small gains or losses assume future is like the past. Introduction to Forecasting.

E N D
Chapter 12 - Forecasting • Forecasting is important in the business decision-making process in which a current choice or decision has future implications: • Routine decisions • very near in the future • small gains or losses • assume future is like the past
Introduction to Forecasting • Business is the main user of Forecasting Methods, but other areas such as State and Federal governments and non-profit organizations (university, hospital, services) use forecasting. • Marketing and operations management is the most obvious function in business to use forecasting. A valid strategy depends on demand expectations.
Introduction to Forecasting • As business majors, you operate and make decisions within the framework of a complex, interrelated, social, economic, and competitive structure. • The success of a firm depends on its ability to compete with firms producing similar products or services from the same market. • Firms must secure information concerning potential market sales to plan effectively.
Introduction to Forecasting • Sales forecasts become the primary information input depicting the state of the environment. • The better and more complete the data, the better the decision will be.
Introduction to Forecasting • Forecasting alleviates uncertainty: • Long and short term forecasts • Forecasts relating to industry trends • Market research relating to consumer surveys • Advertising & Sales promotions • Demand Anticipation • Inventory levels
Introduction to Forecasting • Horizontal Pattern • No trend, stationary • Equally likely chance that the next value will be above the mean or below it • Stable sales, # of defects in production process
Introduction to Forecasting • Seasonal • Fluctuations occur in certain months/quarter during the year. Examples: weather, holidays
Introduction to Forecasting • Cyclical • Similar to seasonal, but the length of cycle is longer than one year: Housing starts, GNP • Difficult to predict because it does not repeat itself at constant intervals
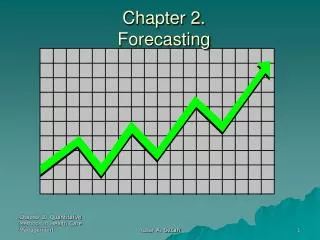
Introduction to Forecasting • Trend • General increase or decrease in value over time • Examples: sales, stock
Accuracy of Techniques & Measurement Error • There will always be some deviation between actual and forecasted values. Our objective is to minimize the deviations with sound analysis • Errors are squared to eliminate signs and emphasize the extreme errors
Types of Models • Time Series • Identify historical patterns and forecast into the future. If we know that sales are 20% above average each January, the forecast for next January should be upward 20%. • This is an inappropriate method for weekly sales fluctuations that are the result of price and advertising changes.
Types of Models • Causal • Assumes that the value of a certain variable is a function of several other variables. • Time Series could be considered causal since actual values are assumed to be a function of the time period. Usually, variables other than time are used. For example, sales as a function of price and advertising. • This is a more complex method than time series.
Types of Models • Statistical Models • Statistical analysis can be used to identify patterns in the variables and in making statements about the reliability of the forecast. Confidence Intervals, R2, Test of Significance • Non-Statistical Models • These models do not follow rules of statistical analysis and probability theory. Usually, they are easy to understand and apply. They are limited because they lack guidelines. • Qualitative models
^ Y Regression Analysis • Once a linear relationship is defined, the independent variable can be used to forecast the dependent variable. = bo + bX • bois called the Y intercept - represents the value of Y when X = 0. But be cautious - this interpretation may be incorrect and difficult to estimate - many times our data does not include 0. Think of this value as representing the influences of the many other independent variables that are not included in the equation. • bX is called the slope - represents the amount of change in Y when X increases by one unit.
Regression Analysis Tools, Data Analysis, Regression - Hint: Include labels in the input ranges to help with the interpretation! Can also include plots (not shown here)
Averages • Naive models • 3 and 5 month moving averages
Exponential Smoothing Methods • Continually revising a forecast in light of more recent experiences. Averaging (smoothing) past values of a series in a decreasing (exponential) manner. The observations are weighted with more weight being given to the more recent observations
Forecast Errors • MAD measures forecast accuracy by averaging the absolute value of the forecast errors (n = number of errors and not sample size). Magnitude of errors. • MSE (Mean Squared Error) - each error is squared, then summed and divided by the number of observations (errors). Identifies large forecasting errors because of the squares • MAPE (Mean absolute percentage error) - percentages. Find the MAD for EACH period then divide by actual of that period and dividing the sum by the number of errors. How large the forecast errors are in comparison to the actual values.
Tracking Signals • Indicate whether a forecast method is accurately predicting. • Tracking Signal = CFE / MAD • It is actually a control chart (see table 12.2 for limits) • Hold-out sample – used to test forecast before applying to practice
OMS 335 - Forecasting • Averages, Regression, Multiple Regression, Smoothing • Seasonality • Measuring Forecast Errors • Combining Forecasts • Great course! Lots of computer experience in Excel and Mini-tab. 2nd Six Weeks – MW 6-9 pm