Download
1 / 26
260 likes | 407 Vues
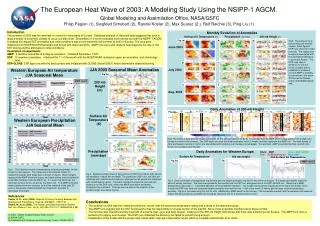
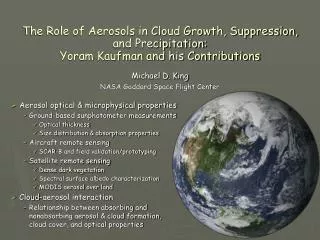
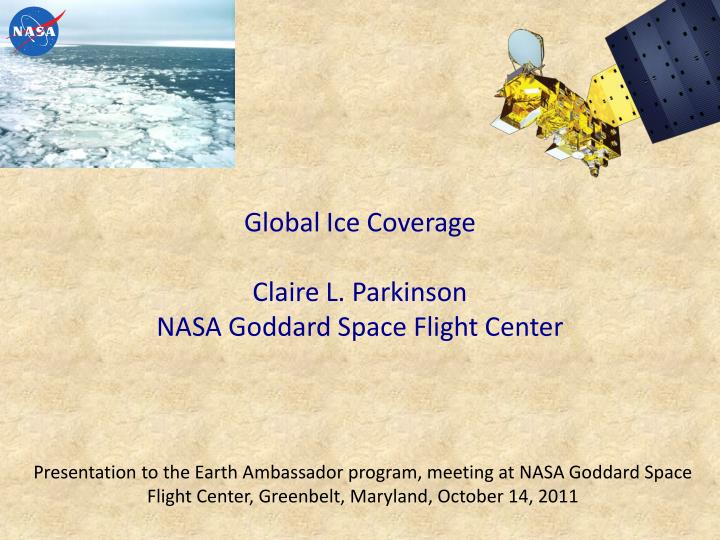
Global Ice Coverage Claire L. Parkinson NASA Goddard Space Flight Center. Presentation to the Earth Ambassador program, meeting at NASA Goddard Space Flight Center, Greenbelt, Maryland, October 14, 2011. Ice and snow in the Andes. Ice: Sample Views. Iceberg. Sea ice. (Photo by C. Parkinson).

E N D
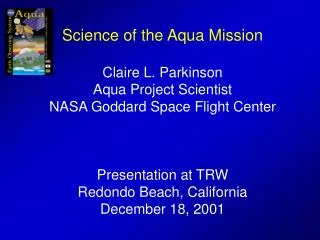
Global Ice CoverageClaire L. ParkinsonNASA Goddard Space Flight Center Presentation to the Earth Ambassador program, meeting at NASA Goddard Space Flight Center, Greenbelt, Maryland, October 14, 2011
Ice and snow in the Andes Ice: Sample Views Iceberg Sea ice (Photo by C. Parkinson) (Photo by M. Deneyer) (Photo by L. Thompson) Sea ice and icebergs from space Antarctic Ice Sheet Greenland Ice Sheet (MODIS image from the Aqua satellite) (MODIS image from the Terra satellite) (Composite image from Canada’s Radarsat)
Animation of 2007 Arctic Sea Ice Coverage, from DMSP Special Sensor Microwave Imager (SSMI) Data White: Highly compact ice. Shades of light blue: Ice of lesser compactness. Images every 2 days DMSP = Defense Meteorological Satellite Program (animation by N. DiGirolamo and C. Parkinson)
Albedo Contrast: Ice versus Water (animation by NASA GSFC SVS, C. Parkinson, M. Starobin, S. DeWitt, available at http://svs.gsfc.nasa.gov/vis/a020000/a020000/a020020/index.html ) (GSFC = Goddard Space Flight Center; SVS = Scientific Visualization Studio)
Monthly Arctic Sea Ice ExtentsNovember 1978 – December 2009 based on data from the Nimbus 7 Scanning Multichannel Microwave Radiometer (SMMR), DMSP SSMI, and Aqua Advanced Microwave Scanning Radiometer for the Earth Observing System (AMSR-E) (extended from C. Parkinson, D. Cavalieri, P. Gloersen, J. Zwally, and J. Comiso, J. Geophysical Research, 1999)
Monthly Arctic Sea Ice Deviations, 11/1978 – 12/2009,from satellite SMMR, SSMI, and AMSR-E data (updated from Parkinson et al. 1999)
Arctic Record Low Sea Ice Coverage, September 14, 2007 from Aqua AMSR-E data (from NASA GSFC SVS)
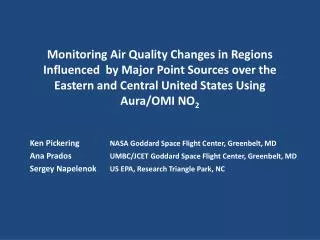
2011 Arctic Sea Ice Coverage, up to October 10, in comparison with earlier satellite data (Map and plot from J. Comiso, C. Parkinson, T. Markus, D. Cavalieri, and R. Gersten, updated weekly on the NASA GSFC Cryospheric Sciences website, at neptune.gsfc.nasa.gov/csb/index.php?section=234)
2011 Arctic Sea Ice Coverage, up to October 10, in comparison with 2005-2010 (Map and plot from J. Comiso, C. Parkinson, T. Markus, D. Cavalieri, and R. Gersten, updated weekly on the NASA GSFC Cryospheric Sciences website, at neptune.gsfc.nasa.gov/csb/index.php?section=234)
Laser Altimetry from the Ice, Cloud, and Land Elevation Satellite (ICESat) (Schematic from the ICESat Science Team)
February-March Arctic Sea Ice Thickness from ICESat Data 2004 2005 2006 2007 2008 MY ice = Multi-year ice FY ice = First-year ice 2004 2005 2006 2007 2008 (Images from Kwok et al. 2009)
Sample Impact of Reduced Sea Ice Coverage on Polar Bears (one of numerous species impacted) • Earlier ice breakup forces earlier polar bear retreat to land. • Changes in Western Hudson Bay polar bears: • Population decrease from about 1,200 in 1989 to about 950 in 2004. • Adult female average weight, 295 kg in 1980, 230 kg in 2004. Date of Western Hudson Bay ice breakup down to 50%(From I. Stirling and C. Parkinson, 2006) (Photo by Robert Taylor)
Animation of 2007 Antarctic Sea Ice Coverage from DMSP SSMI Data White: Highly compact ice. Shades of light blue: Less compact ice. Images every 2 days. (animation by Nick DiGirolamo and Claire Parkinson)
Winter and Summer Southern Ocean Sea Ice Coverages Derived from Satellite Passive-Microwave Data The values mapped are sea ice concentrations (percent areal coverages of ice).
Monthly Antarctic Sea Ice ExtentsNovember 1978 – December 2009 from satellite SMMR, SSMI, and AMSR-E data (extended from J. Zwally, J. Comiso, C. Parkinson, D. Cavalieri, and P. Gloersen, J. Geophysical Research, 2002)
Monthly Antarctic Sea Ice Deviations, 11/1978 – 12/2009,from satellite SMMR, SSMI, and AMSR-E data (updated from Zwally et al. 2002)
2011 Antarctic Sea Ice Coverage up to October 10, in comparison with earlier satellite data (from J. Comiso, C. Parkinson, T. Markus, D. Cavalieri, and R. Gersten, updated weekly at neptune.gsfc.nasa.gov/csb/index.php?section=234)
Yearly Averaged Sea Ice Extents, 1979-2006, for Five Southern Ocean Regions and the Total Weddell Sea Indian Ocean Western Pacific Ocean Ross Sea Bellingshausen/Amundsen Seas (from C. Parkinson and D. Cavalieri)
The Earth’s Two Remaining Massive Ice Sheets as imaged by the Moderate Resolution Imaging Spectroradiometer (MODIS) on the Aqua satellite Antarctica, composite image from several dates Greenland, July 13, 2002
Formation of Iceberg B15 and Its Breaking Off from Antarctica’s Ross Ice Shelf, from the Terra MODIS 3/3/2000 3/28/2000
Recent Changes in the Greenland Ice Sheet Elevation changes, 2003-2006, derived from ICESat data Changes in ice mass, 2003-2008, derived from GRACE data (From S. Luthcke and the GRACE Science Team) (From J. Zwally and the ICESat Science Team) ICESat = Ice, Clouds, and Land Elevation Satellite GRACE = Gravity Recovery and Climate Experiment
Recent Changes in the Antarctic Ice Sheet Trend in the equivalent depth of water (cm/yr) in the Antarctic ice sheet, July 2003 – July 2007, from GRACE satellite data (from S. Luthcke and the GRACE Science Team)
Global Sea Level Change, 1993-2006,from radar altimeters on TOPEX/Poseidon and Jason-1 Spatial distribution of sea level change, 1993-2006 Globally averaged sea surface height, 1993-2006 TOPEX = Topography Experiment (From G. Mitchum and R. Nerem, 2007)
Summary • Most of the Earth’s ice is in the ice sheets of Greenland and Antarctica. • Substantial additional ice exists in other glaciated land areas and in the sea ice covers of the Arctic and the Antarctic. • Satellite passive-microwave data have revealed many details about the global sea ice cover, including large seasonal cycles, much interannual variability, and statistically significant overall trends in the ice covers since the late 1970s. • Overall, the Arctic sea ice has decreased substantially since the late 1970s. • The Antarctic sea ice has increased somewhat since the late 1970s. • Satellite altimeters and gravity monitors have revealed changes in the Greenland and Antarctic ice sheets. • Decreases in land ice coverage have contributed to sea level rise.