Download
1 / 37
370 likes | 495 Vues
Sea Ice Exchange across the Canadian Arctic Archipelago from Microwave Satellites . T. A. Agnew 1 , J. Vandeweghe 2 , and A. Lambe 2 1 Environment Canada, Toronto, Canada 2 Engineering Department, University of Toronto, Toronto, Canada. Microwave Satellite Data.

E N D
Sea Ice Exchange across the Canadian Arctic Archipelago from Microwave Satellites T. A. Agnew1, J. Vandeweghe2, and A. Lambe2 1 Environment Canada, Toronto, Canada 2 Engineering Department, University of Toronto, Toronto, Canada
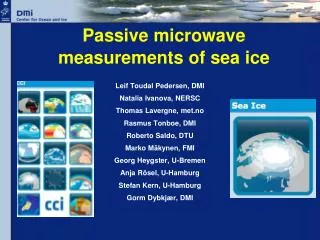
MicrowaveSatellite Data • Advanced Microwave Scanning Radiometer (AMSR): 4-year period September 2002 to June 2006. • RADARSAT: for the earlier period (1998-2002) by Ron Kwok • From these satellites you can get sea-ice area flux, to obtain ice volume fluxes you need contemporaneous ice thickness which is almost never available, use proxy estimates of ice thickness from bore hole estimates in the region, ULS (submarine, moored sites) and general knowledge of ice types in the region. • AMSR provides daily estimates of ice motion every 6 pixels (37.5 km) and ice concentration at resolution of 12 km. However there is no data for July and August because ice motions are unreliable due to atmospheric moisture (10-month average Sept - June) • RADARSAT provides 3-day ice motions on a 5 km grid but only for northern parts of the Archipelago. • Define a number of flux gates surrounding the Archipelago and calculate the sea ice area flux
Fluxgates surrounding the Archipelago }QEI-S }QEI-N
Estimating Ice-area Flux across the Gate using AMSR 1. Obtain an independent ice motion estimate every 6 pixels (37.5 km ) which is interpolate to an estimate of ice motion ui at each 25 km intervals Δx along each fluxgate and similarly for concentration ci. 2. Daily Ice Area Flux = ∑ ci ui Δx Sea Ice Motion Error Compare with Arctic Drifting Buoys Error in Daily Sea-ice Area Flux 1. Error in ui is 4.64 km/day, error in ci is 10%, error in ci ui is σf = 4.74 km/day 2. For example, AG gate is L = 180 km, Ns = 180 km/37.5 km = 5, error daily flux across the gate is σT = σf L/(Ns) ½ = 380 km2. 3. Monthly error: σ m = σT (Nd) ½ = 2100 km2 /month
Cumulative 10-month Area Fluxes (103 km2) each year * Negative means export toward the Arctic Ocean **thickness from Melling (2002)
Average Monthly Area Flux for the Northern Gates Negative means transport toward Arctic Ocean
AO index and Atmospheric Circulation over the Arctic Ocean Curtesy of Ignatias Rigor
Pressure Gradient-Area Flux Corr = .77 Corr = .74 Negative means transport toward Arctic Ocean
RADARSAT and AMSR-E Comparison for Gates facing the Arctic Ocean *Negative means export into the Arctic Ocean +Kwok (2005, 2006) **Melling (2002)
Cumulative 10-month Area Fluxes (103 km2) each year * Positive means export into Baffin Bay **thickness from Melling (2002)
Average Monthly Area Flux for the Southern Gates Positive means transport toward Baffin Bay
Net Change in Ice Area for the CAA (Net = AG+MS+QEI –LS–JS) *Negative means net loss of sea ice
Net Volume Advection (Net = AG+MS+QEI –LS–JS) *Negative means net loss of sea ice
Advection versus Melt/Growth 2006 2005 (import–export) 2004 2003 (growth – melt)
Conclusions • Amundsen Gulf and M’Clure Strait are net exporters of sea ice into the Arctic Ocean (fall and winter) and QEI north and south gates import ice from the Arctic Ocean. The monthly variability depends on large scale circulation (strength and location of the Beaufort Sea High). • Combining both satellite results, there is net export of about 50 km3 yr-1 into the Arctic Ocean and there is a export of 100 km3 yr-1into Baffin Bay. This ice is generated from within the Archipelago itself. • The net ice advection each month is about 10% of the monthly change due to ice growth/melt. • These fluxes are considerably less than the flux of sea ice through Fram Strait (~ 2800 km3 yr-1).
Cumulative 10-month area fluxes in 103 km2 each year Note: Positive means flux southward or toward Baffin Bay ** Transport for 10-months of the year
Monthly Ice Area Flux Positive means transport south
Pressure Gradient-Area Flux Negative means transport toward Arctic Ocean
Monthly Ice Area Flux Positive means transport south
Cumulative 10-month area fluxes in 103 km2 each year Note: Positive means flux southward or toward Baffin Bay ** Transport for 10-months of the year
Modeling Sea Ice Formation/Transport in Baffin Bay Model daily ice transport, ice production and salt re-distribution using sea ice cover from AMSR rather than estimating the surface energy budget and then melting or growing the ice thermodynamically. Previous days ice cover, advect it by the ice motion, compare with the next days ice cover, ice is grown/melted to make the advected ice field match the next days ice cover (Pedersen and Coon, 2004) We obtain each day from AMSR, sea ice concentration, sea ice type, sea ice thickness, sea ice motion Advect the sea ice using a trajectory method to reduce numerical diffusion problems
Net Freezing 2004/05 Bathymetry 2003/04
Salt Redistribution 2004/05 2003/04
Cumulative 10-month Volume Flux in km3 each year * Negative means export toward the Arctic Ocean **Melling (2002)
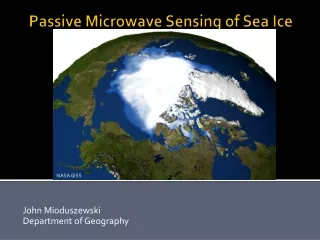
MicrowaveSatellites • Penetrate most cloud and do not require solar illumination • RADARSAT resolution of 150 m and repeat coverage is 3 days (1998-2002) • RADARSAT relies on surface scattering so you cannot get a contemporaneous ice thickness directly, must rely on proxy estimates of ice thickness • Advance Microwave Scanning Radiometer for EOS (AMSR-E) daily repeat coverage but resolution 6 to 12 km and no ice motion estimates in July and August (2003-2006) • AMSR is multi-channel/polarization and so has some skill in estimating thickness of FYI • Define a number of flux gates surrounding the Archipelago and calculate the sea ice area flux