Download

1 / 43
1.52k likes | 3.66k Vues
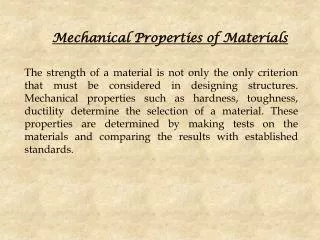
MECHANICAL PROPERTIES OF MATERIALS. Thursday, 3 March 2005. MECHANICAL PROPERTIES AND TESTING OF MATERIALS. The Tensile Test Compression The Bend Test The Hardness Test The Impact Test The Fatigue Test The Creep Test. Structure-Property-Processing Relationship.

E N D
MECHANICAL PROPERTIES OF MATERIALS Thursday, 3 March 2005
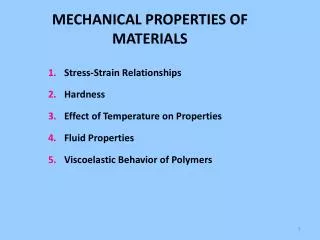
MECHANICAL PROPERTIES AND TESTING OF MATERIALS • The Tensile Test • Compression • The Bend Test • The Hardness Test • The Impact Test • The Fatigue Test • The Creep Test
Structure-Property-Processing Relationship Figure 1The three-part relation- ship between structure, Properties, and processing Method.
Properties of A Material • Mechanical Properties How a material responds • To an applied force, include strength and ductility. • To a sudden, intense blow (impact) • To a continually cycled through an alternating force (fatigue) • To a high temperatures (creep) • To an abrasive conditions (wear) Also determine the ease with which a material can be deformed into a useful shape. • Physical Properties: electrical, magnetic, optical, thermal, elastic, and chemical behaviour depend on both structure and processing of a material.
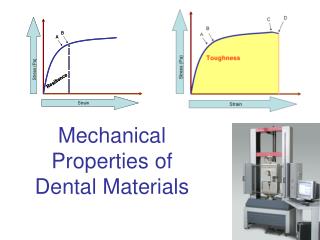
The Tensile Test • Measures the resistance of a material to a static or slowly applied force. • Strength • Ductility • Toughness • Elastic Modulus • Strain Hardening • Tension-test specimen: Solid and round (ASTM: lo=50mm and =12.5mm) standard, flat-sheet or tubular.
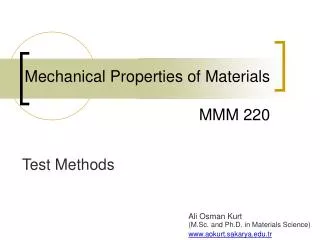
Use of the Stress-Strain Diagram • Tensile strength: the stress that corresponds to the maximum load in a tensile test. • Ductility: the ability of material to be permanently deformed without breaking when a force is applied. • Modulus of elasticity: Young’s modulus, or the slope of the stress-strain curve. • Toughness: a qualitative measure of the impact properties of a material. A material that resists failure by impact is said to be tough. • Strain hardening:
Mechanical Properties of Various Materials at Room Temperature
The Conversions from Load-Gage Length to Stress-Strain • Engineering stress = = F/Ao • Engineering strain = = (l-lo)/lo Where : Ao = the original cross sectional area of the specimen before the test begins lo = the original distance between the gage marks l = the distance between the gage marks after force F is applied
Table 1 Tensile Test Data of a 0.505 in. diameter Al-alloy test bar
Examples 1: • Convert the load-gage length data in Table 1 to engineering stress and strain and plot a stress-strain curve and calculate: • The tensile strength • The % elongation • The engineering stress at fracture • An aluminium rod is to widhstand an applied force of 45000 pounds. To assure a sufficient factor of safety, the max. allowable stress on the rod is limited to 25000 psi. The rod must be at least 150 in. long but must deform elastically no more than 0.25 in. when the force is applied. Design an appropriate rod.
Properties Obtained from the Tensile Test • Yield Strength • Tensile Strength • Elastic Properties • Ductility • True Stress and True Strain • Effect of Temperature • Effect of Deformation Rate
Yield Strength • The strength at which plastic deformation becomes noticable. • The stress required for dislocation to slip (in metals). • The stress that divides the elastic and plastic behaviour of the material. • When designing a part that will not plastically deform: • Select a material that has a high yield strength • Make the component large so that the applied force produces a stress that is below the yield strength.
OFFSET YIELD STRENGTH – in some materials, the stress at which the material changes from elastic to plastic behaviour is not easily detected. • The stress-strain curve for certain low-carbon steels displays a double yield point. Figure 2 (a) Determining the 0.2% offset yield strength in gray cast iron and (b) Upper and lower yield point behaviour in low carbon steel.
Tensile Strength (UTS) • The stress obtained at the highest applied force, which is the maximum stress on the engineering stress strain curve. • If the specimen is loaded beyond its UTS, it begins to neck (locally deformed region). As the test progresses, the engineering stress drops further and the specimen finally fractures at the necked region. The engineering stress at fracture is known as breaking or fracture stress.
Elastic Properties • The ratio of stress to strain in the elastic region: modulus of elasticity or Young’s modulus (after T. Young, 1773-1829), E. • The modulus is a measure of stiffness of the material. Hooke’s law (after R. Hooke, 1635-1703): Modulus of elasticity, E = / • Modulus of Resilience (Er):the area contained under the elastic portion of a stress-strain curve, is the elastic energy that a material absorbs during loading and subsequently releases when the load is removed. Er = yield strength/[(2)(strain at yielding)] • Poisson’s ratio, (after S. D. Poisson, 1781-1840) = - lateral/ longitudinal
Ductility • Measures the amount of deformation that a material can withstand without breaking. • % elongation = [(lf-lo)/lo]x100 • % reduction in area = [(Ao-Af)/Ao]x100 Example 2: The Al alloy in example 1 has a final gage length after failure of 2.195 in. and final diameter of 0.398 in. at the fractured surface. Calculate the ductility of this alloy.
True Stress and True Strain • True Stress is the ratio of the load F to the actual (instantaneous) cross-sectional area A of the specimen. True stress, = F/A • True Strain, = ln (l/lo)
Strain Hardening • We can represent the true stress-true strain curve by the equation: = K n Where K = the strength coefficient. n = the strain hardening (work hardening) exponent. • Plotting the corrected curve in Fig. 2.5c on a log-log graph – approximately a straight line (Fig. 2.5d). The slope of the curve is equal to exponent n. Thus, the higher the slope, the greater the strain hardening capacity of the material – the stronger and harder it becomes as it is strained.
Effect of Temperature Figure 3 The effect of temperature (a) on the stress-strain curve (b) on the tensile Properties of an Al alloy.
Effect of Deformation Rate • Deformation rate is defined as the speed at which a tension test is being carried out, in units of, say m/s or ft/min. • The strain rate is a function of the specimen length. • Increasing the strain rate increases the strength of the material (strain-rate hardening).
Compression • Forging, rolling, extrusion are performed with the workpiece subjected to compressive forces. • Compression test: compressing a solid cylindrical specimen between two flat dies (platens). The friction between the specimen and the platens, the specimen’s cylindrical surface bulges (barreling). • True stress-true strain curves for the tensile and compression tests for ductile material coincide. But this comparability does not hold true for brittle materials.
For brittle materials such as ceramic and glasses. The disk is subjected to compression between two hardened flat platens. When the material is loaded, tensile stress develop perpendicular to the vertical centerline along the disk, fracture begins, and the disk splits in half vertically. The tensile stress, is uniform along the centerline and can be calculated as = 2P/[dt] P= load at fracture d= diameter of the disk t = thickness of the disk. Disk Test
The Bend Test • In brittle materials, failure occurs at the maximum load, where the tensile strength and breaking strength are the same. How about with ductile materials ? • In many brittle materials- flaws at the surface Bend test • By applying the load at 3 points and causing bending, a tensile force acts on the material opposite the midpoint. Fracture begins at this location.
Flexural strength or modulus of rupture describes the material’s strength. Flexural strength =3FL/(2wh2) • Flexural modulus is the modulus elasticity in bending and is calculated in the elastic region. Flexural modulus = L3F/4wh3 Figure 4 (a) The bend test often used for Measuring the strength of brittle materials, and (b) The deflection obtained by bending.
Hardness Test • Measures the resistance to penetration of the surface of a material by a hard object. • Brinell, Rockwell, Vickers, Knoop. • Tensile strength (psi) = 500 HB • Hardness correlates well with wear resistance.
Impact Test • To evaluate the brittleness of a material under a sudden, intense blow, in which a strain rate is extremely rapid. • Charpy and Izod test. • Izod for nonmetallic materials. The specimen may be either notched or unnotched. • Knowing the initial and final elevations of the pendulum, we can calculate the difference in potential energy (impact energy absorbed by the specimen during failure). • Toughness ??
Properties Obtained from the Impact Test • Transition temperature Results of a series of impact tests performed at various temperature. • Notch sensitivity Caused by poor machining, fabrication or design concentrate stresses and reduce the toughness of the material. Compare the absorbed energy between notched and unnotched specimen. • Relationship to the stress-strain diagram.
The area contained within the true stress- True strain curve is related to the impact Energy. Although material B has a lower Yield strength, it absorbs a greater energy Than material A. Charpy V-notch properties for BCC Carbon steel and a FCC ss. FCC crystal Structure typically leads to higher Absorbed energies and no transition Temp.
A component often subjected to the repeated application of a stress below the yield strength of the material. Cyclical stress: rotation, bending, or vibration. Although the stress is low, the material may fail after a large number of applications of the stress. The Fatigue Test The rotating cantilever beam Fatigue test.
3 Stages of Fatigue • Tiny cracks initiates at the surface. • The crack gradually propagates as the load continues to cycle. • Sudden fracture of the material occurs when the remaining cross section of the material is too small to support the applied load.
Results of the Fatigue Test • Endurance limit: the stress below which there is a probability that failure by fatigue will never occur – design criterion. • Fatigue life: how long a component survives at a particular stress • Fatigue strength: max stress for which fatigue will not occur within a particular number of cycles, such as 500000 cycles (for Al and polymers which have no endurance limit). • In some materials, endurance limit half tensile strength. Endurance ratio= endurance limit/tensile strength 0.5 The stress-number of cycles to Failure (S-N) curves for a tool Steel and an Al alloy.
The Creep Test • CREEP: Plastic deformation at high temperatures = stress + high temperature. • As soon as the stress is applied, the specimen stretches elastically a small amount depending on the applied stress and the modulus elasticity o of the material at high temperature.