Download
1 / 71
3.95k likes | 9.15k Vues
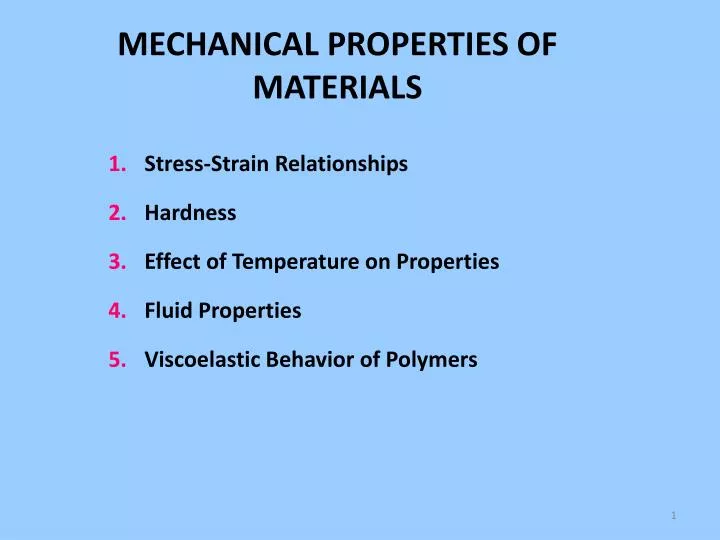
MECHANICAL PROPERTIES OF MATERIALS. Stress‑Strain Relationships Hardness Effect of Temperature on Properties Fluid Properties Viscoelastic Behavior of Polymers. Mechanical Properties in Design and Manufacturing.

E N D
MECHANICAL PROPERTIES OF MATERIALS Stress‑Strain Relationships Hardness Effect of Temperature on Properties Fluid Properties Viscoelastic Behavior of Polymers
Mechanical Properties in Design and Manufacturing Mechanical properties determine a material’s behavior when subjected to mechanical stresses . Properties include elastic modulus (elastik katsayısı) ductility (çekilebilme, ezilebilme, kolay şekillenme) hardness, various measures of strength Mechanical properties are important indesign because the function and performance of a productdepend on its capacity to resist deformation under the stressesencountered in service.
Mechanical Properties in Design and Manufacturing In design, for theproduct and its components, the usual objective is to withstand these stresses withoutsignificant change in geometry.This capability depends onproperties such as elastic modulus and yield strength. Inmanufacturing, theobjective is just theopposite.Here, stressesthat exceed the yield strength of thematerialmust be appliedtoalteritsshape Dilemma: mechanical properties that are desirable to the designer, such as high strength, usually make manufacturing more difficult.
Stress‑Strain Relationships Three types of static stresses to which materials can be subjected: Tensile –(germe)stretchingthe material Compressive -(sıkıştırma) squeezing the material Shear - (kayma, akma) causing adjacent portions of the material to slide against each other Stress‑strain curve - basic relationship that describes mechanical properties for all three types.
The tensile test is the most common procedure for studying • the stress–strain relationship, • particularly for metals. • In the test, a force is applied that pulls the material, tending to • elongate it and reduce its diameter, as shown in Figure 3.1(a). Tensile (Germe) Test
ASTM (American Society for Testing and Materials) specifies preparation of test specimen Tensile Test Specimen
Tensile testing machine Tensile Test Setup
The starting test specimen has an original length Lo and area Ao. The length ismeasured as the distance between the gage marks, and the area is measured as the (usuallyround) cross section of the specimen. During the testing of a metal, the specimen (1) , stretches (2 and 3),then necks (4), and finally fractures (5), as shown intheFigure Tensile Test Sequence • no load; • uniform elongation and area reduction; • Elongationcontinues, maximum loadreach; • Necking, loadbeginstodecrease; • fracture; • putting pieces back together to measure final length
- Stressis a measure of the average force per unit area of a surface within a body. - Strain is a normalized measure of deformation representing the displacement between particles in the body relative to a reference length. Stress-StrainRelationship Therearetwodifferenttypes of stress-straincurves : (1) engineering stress–strain (2) true stress–strain. The first is more important indesign, and the second is more important in manufacturing.
Defined as force divided by original area: (1) Engineering Stress S = where S = e= engineering stress, F= applied force, Ao= original area of test specimen
Defined at any point in the test as (1) Engineering Strain where e= engineering strain; L= length at any point during elongation, mm Lo= original gage length, mm The units of engineering strain are given as mm/mm (in/in), but think of it asrepresenting elongation (uzama) per unit length, without units.
Elastic Region in Stress‑Strain Curve Relationship between stress and strain is linear, material returns to its original length when stress is removed Hooke's Law: s= E . e where s=the restoring force exerted E =modulus of elasticity (elastiklik katsayısı),(constant),(in SI units: N/m or kg/s2) e=the displacement (uzama) - Eis a measure of the inherent stiffness of a material. - Its value differs for different materials
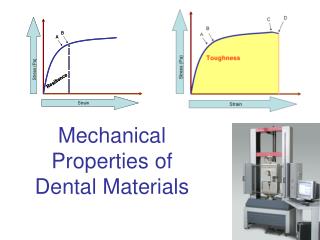
(1) Typical Engineering Stress-Strain Plot Typical engineering stress‑strain plot in a tensile (germe) test of a metal Two regions: • Elastic region • Plastic region
Yield Point in Stress‑Strain Curve As stress increases, a point in the linear relationship is finally reached when the material begins to yield (gevşemek , dayanamamak) (Y = a strength property) Yield point,Ycan be identified by the change in slope at the upper end of the linear region Other names for yield point: Yield strength Yield stress Elastic limit
Plastic Region inStress‑Strain Curve Yield point marks the beginning of plastic deformation The stress-strain relationship is no longer guided by Hooke's Law As load is increased beyond Y, elongation proceeds at a much faster rate than before, causing the slope of the curve to change dramatically
Tensile Strength in Stress‑Strain Curve Elongation is accompanied by a uniform reduction in cross‑sectional area, consistent with maintaining constant volume Finally, the applied load F reaches a maximum value, and engineering stress at this point is called the tensile strength,TS. (ultimate tensile strength – dayanma sınırı) TS = F max = maximumforce A0 = originalarea of specimen, mm2
necking Tensile Strength in Stress‑Strain Curve To the right of the tensile strength on the stress–strain curve, the load begins to decline,and the test specimen typically begins a process of localized elongation known as necking. Instead of continuing to strain uniformly throughout its length, straining becomes concentrated in one small section of the specimen.
necking Tensile Strength in Stress‑Strain Curve The area of that section narrows down (necks) – (boyun verme) significantly until failure (fracture) – (kopma) occurs The stress calculated immediately before failure is known asthefracturestress.
Ductility in Tensile Test The amount of strain that the material can endure before failure is also a mechanicalproperty of interest in many manufacturing processes. The common measure of thisproperty is ductility,the ability of a material to plastically strain without fracture. Ductility measure = EL (elongation) (uzama) where EL= elongation (uzama ölçüsü); Lf= specimen length at fracture; Lo= original specimen length ( Lf is measured as the distance between gage marks after two pieces of specimen are put back together)
(2) True Stress The actual (instantaneous) areamay be used instead of the original areaof the test specimen to calculate engineering stress. The actual area (belli andaki kesit) becomes increasingly smaller as the test proceeds. If the actual area is used,the calculated stress value will be higher. The stress value obtained by dividing theapplied load into theinstantaneous value of area(belli andaki kesit)is defined as thetrue stress ( s ) where = true stress, MPa; F= force (appliedload) (N); A= actual (instantaneous) (o andaki)area resisting the load, mm2
True Strain The value of true strain in a tensile test can beestimated by dividing the total elongation into small increments, calculating the engineeringstrain for each increment on the basis of its starting length, and then adding up thestrain values. In the limit, true strain,e is defined as where L = instantaneous length at any moment during elongation.
True Stress-Strain Curve When the engineering stress–strain data are plotted using the true stressand strain values, the resulting curve would appear as in Figure 3.4. In the elastic region, the plot is virtually the same as before. Strain values are small, and true strain is nearly equal toengineering strain for most metals of interest.
True Stress-Strain Curve The difference between the true stress–strain curve and its engineering counterpart occurs in the plastic region. The stress values are higher in the plastic region because theinstantaneous cross-sectional area of the specimen, which has been continuouslyreducedduring elongation, is now used in the computation.
True Stress-Strain Curve As in the previous curve, a downturnfinally occurs as a resultofnecking. Adashed line is used in the figure to indicate the projectedcontinuation of the true stress–strain plot if necking had not occurred.
Strain Hardening in Stress-Strain Curve Note that true stress increases continuously in the plastic region until necking. In the engineering stress‑strain curve, the significance of this was lost because stress was based on the original area value. Nowthatthetruestress also increases, it must be considered. What it means is that the metal isbecoming stronger as strain increases. This is the property called strain hardening that wasmentioned in the previous chapter in the discussion of metallic crystal structures, and it is aproperty that most metals exhibit to a greater or lesser degree.
Strain Hardening in Stress-Strain Curve - Strain hardening, or work hardening as it is often called, is an important factor in certainmanufacturing processes, particularly metal forming. - The behavior of a metal as it isaffected by this property can be shownby a graph.
If the portion of the true stress–strain curve representing the plasticregion were plotted on a log–log scale, the result would be a linear relationship, as shown intheFigure . True Stress-Strain in Log-Log Plot True stress‑strain curve plotted on log‑log scale.
Flow Curve where s = truestress K= strength coefficient; e = truestrain n = strain hardening exponent Theequation is called a flowcurve. Because it is a straight line in a log-log plot, the relationship between true stress and true strain in the plastic region is
Categories of Stress-Strain Relationship Much information about elastic–plastic behavioris provided by the true stress–strain curve. As indicated, Hooke’s law governs themetal’s behavior in the elastic region, and the flow curve determines the behaviorin the plastic region. Three basic forms of stress–strain relationship describe the behavior ofnearly all types of solid materials.
Categories of Stress-Strain Relationship: 1.Perfectly Elastic Behavior is defined completely by modulus of elasticity E Material fracturesrather than yielding to plastic flow Brittle materials: ceramics, many cast irons, and thermosetting polymers These materials are not good candidates for formingoperations.
Stress-Strain Relationships: 2.Elastic and Perfectly Plastic Stiffness defined by modulus of elasticity E Once Y(yieldstrength) reached, deforms plastically at same stress level Metals behave like this when theyhavebeenheated to sufficiently high temperatures (above recrystallization)that they recrystallize rather than strain hardenduringdeformation.
Stress-Strain Relationships: 3.Elastic and Strain Hardening This material obeys Hooke’s law in the elastic region. Itbegins to flow at its yield strength Y. Continued deformation requires an ever-increasingstress, given by a flow curve whose strength coefficient K is greater than Y (yieldstrength) and whosestrain-hardening exponent n is greater than zero. Most ductile metals behave this waywhencoldworked.
CompressionProperties - Compression Test Compression test appliesa load that squeezes the ends of a cylindrical specimen between two platens. As the specimen is compressed, its height is reducedand its cross-sectional area is increased. FIGURE 3.7 Compression test: (a) (1) compressionforceapplied to test piece, (2) Resultingchange in heightanddiameter;
Compression Test Setup FIGURE 3.7 (b) setup for the test, with size of test specimen exaggerated.
Engineering Stress in Compression As the specimen is compressed, its height is reduced and cross‑sectional area is increased. Engineering stress (s) is defined as s= where F = appliedload Ao= original area of the specimen
Engineering Strain in Compression Engineering strain is defined where h = height of the specimen at a particular moment in the test, mm (in); ho = starting height, mm (in). Since height is reduced during compression, value of e is negative (the negative sign is usually ignored when expressing compression strain)
Stress-Strain Curve in Compression When engineering stress is plotted against engineering strain in a compression test, theresults appear as in Figure 3.8. The curve is divided into elastic and plastic regions, as before,but the shape of the plastic portion of the curve is different from its tensile test complement.
Stress-Strain Curve in Compression Because compression causes the cross section to increase (rather than decrease as in thetensile test), the load increasesmore rapidly than previously. This results in a higher value ofcalculatedengineeringstress.
Tensile Test vs. Compression Test Although differences exist between engineering stress‑strain curves in tension and compression, the true stress‑strain relationships are nearly identical Since tensile test results are more common, flow curve values (K and n) from tensile test data can be applied to compression operations . When using tensile K and n data for compression, necking should be ignored. Compression operations in metal forming are much more common than stretchingoperations. Important compression processes in industry includerolling, forging, andextrusion.
Bending Test Specimen of rectangular cross‑section is positioned between two supports, and a load is applied at its center. Bending of a rectangular cross section results in both tensile and compressive stresses in the material: initial loading(left) ; highly stressed and strained specimen(right)
Bending Test Bending operations are used to form metal plates and sheets. The process of bending a rectangular cross section subjects the material to tensile stresses(and strains) in the outer half of the bent section and compressive stresses (and strains) inthe inner half. If the material does not fracture, it becomes permanently (plastically) bentas shown in (2) of Figure 3.10.
Testing of Brittle Materials Hard brittle materials (e.g., ceramics) possess elasticity but little or no plasticity Conventional tensile test cannot be easily applied Often tested by a bendingtest (also called flexure test)
Testing of Brittle Materials Brittle materials do not bend (flex) They deform elastically until fracture Failure occurs because tensile strength of outer fibers of specimen are exceeded Failure type: cleavage (bölünme)- common with ceramics and metals at low temperatures, in which separation rather than slip occurs along certain crystallographic planes
Transverse Rupture Strength where TRS= transverse rupture strength; F= applied load at fracture (N); L= length of specimen between supports (mm); band t are dimensions of cross section (mm) (transverse rupture = enine kırılma) The strength value derived from the bending test:
Shear Properties Shear (kayma, eğme) involves application of stresses in opposite directions on either side of a thin elementtodeflect it. (a) shear (kayma, akma) stress and (b) shear strain
Shear Stress and Strain Shear stress, t, defined as where F= applied force; A = area over which deflection occurs. Shear strain, g, defined as where = deflection (eğilmek)of theelement; b= distance over which deflection occurs
Torsion (Burma) Stress-Strain Curve Shear stress and strain are commonly tested in a torsion test, in which a thin-walledtubular specimen is subjected to a torque as shown in Figure 3.12. As torque is increased, the tube deflects by twisting, which is a shear strain for this geometry. FIGURE 3.12 Torsion test setup.
Torsion Stress-Strain Curve Typical shear stress‑strain curve from a torsion test
Shear Elastic Stress‑Strain Relationship where t = shearstress G = shear modulus, or shear modulus of elasticity g = shearstrain For most materials, G 0.4E, where E = elasticmodulus In the elastic region, the relationship is defined as
Hardness The hardness of a material is defined as its resistance to permanent indentation (iz, çentik) Goodhardness generally means that the material is resistant to scratching and wear. For manyengineering applications, including most of the tooling used in manufacturing, scratchand wear resistance are important characteristics. There is a strong correlation between hardness and strength.