Download
1 / 17
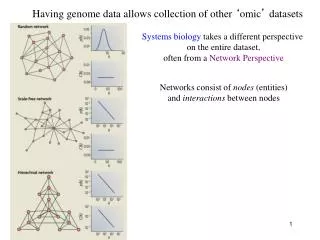
170 likes | 265 Vues
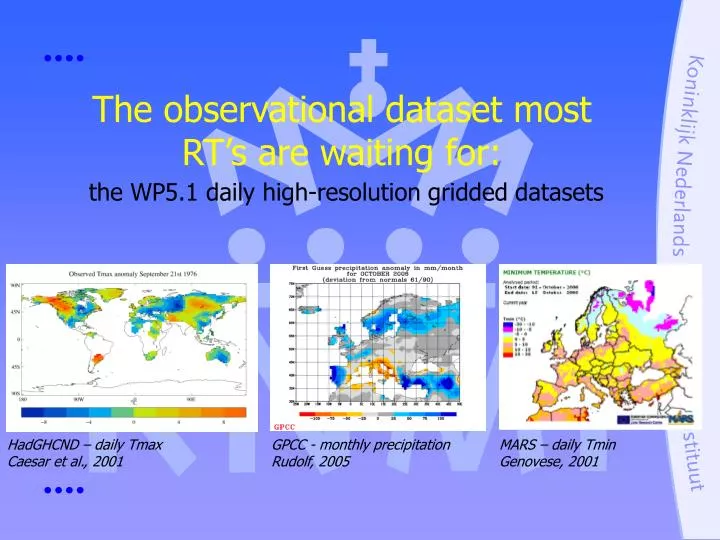
HadGHCND – daily Tmax Caesar et al., 2001. GPCC - monthly precipitation Rudolf, 2005. MARS – daily Tmin Genovese, 2001. The observational dataset most RT’s are waiting for: the WP5.1 daily high-resolution gridded datasets. Why?.

E N D
HadGHCND – daily Tmax Caesar et al., 2001 GPCC - monthly precipitation Rudolf, 2005 MARS – daily Tmin Genovese, 2001 The observational dataset most RT’s are waiting for:the WP5.1 daily high-resolution gridded datasets
Why? …developing dailyhigh-resolution gridded observational datasets for Europe? • Evaluation of the ENSEMBLES simulation/prediction system • Scenario construction • Impact assessment • Analysis of climate extremes
Project partners • KNMI, Lisette Klok & Albert Klein Tank • MeteoSwiss, Evelyn Zenklusen & Michael Begert • University of East Anglia, Malcolm Haylock & Phil Jones • University of Oxford, Nynke Hofstra & Mark New
Overview • Variables and grid • Stations and series • Homogeneity • Interpolation • Data availability
Variables and grid • daily observations • Tmax, Tmin, Tmean, RR, mslp, snow depth • regular 0.25 degree grid and/or an equal area grid • 1960-2004 or present Domain
ECA&D coverage 2004 Station locations Data sources: • ECA&D • EMULATE • STARDEX • GSN • GHCN - daily • MAP project • MARS 2033 stations
Series • 1831 precipitation • 1384 Tmax • 1388 Tmin • 1244 Tmean • 317 mslp • 180 snow depth • quality controlled • updated with SYNOP data
Homogeneity – results of the absolute test following the method of Wijngaard et al., 2004
Vera-QC (Begert et al., in preparation) Only complete series Period: 1960-2000 Number of break-points detected: 0() 1() 2() 3() >4() undefined () mean temperature precipitation Homogeneity – results of the relative test
Homogeneity – results of the relative test [°C] [°C] [°C] Frequency distribution of shift dimensions for temperature
Interpolation methods • Natural Neighbour Interpolation • Angular Distance Weighting • Thin Plate Splines • Kriging • Conditional Interpolation (only rainfall)
Selection of best method and validation • Cross validation • Remove one station and interpolate to location of that station • Compare results with observed values and calculate skill scores (e.g. RMSE, LEPS) • Comparison with grids from high resolution station series • E.g. UK 5*5 km rainfall, Switzerland rainfall and Norway • Compare results with gridded datasets and calculate skill scores
Interpolation results LEPS skill scores averaged across all methods
Uncertainties in the interpolation results • Still looking for appropriate method to determine uncertainties • Will be in the form of uncertainty bands around the interpolated value • Different uncertainty bands for every grid for every day
Data availability • Gridded datasets (September 2007): http://www.ensembles-eu.org/ >> RT5 site • Daily station series (if public!): http://eca.knmi.nl