Download
1 / 17
170 likes | 176 Vues
Star Characteristics – Putting it all together: The H-R Diagram. The Hertzsprung-Russell ( H-R ) diagram is a graph that separates the effects of temperature and surface area on stellar luminosities. It is one of the most important analysis and reference tools in stellar astronomy.

E N D
Star Characteristics – Putting it all together: The H-R Diagram
The Hertzsprung-Russell (H-R) diagram is a graph that separates the effects of temperature and surface area on stellar luminosities. • It is one of the most important analysis and reference tools in stellar astronomy.
Luminosity, Temperature, and Diameter • An H-R diagram has luminosity on the vertical axis and temperature on the horizontal axis. • A star is represented by a point on the graph that shows its luminosity and temperature.
The diagram also contains a scale of spectral types across the top. • Note the symbol Θ: itrefers to the Sun.
The main sequence is the region of the diagram running from upper left to lower right. • It includes roughly 90 percent of all normal stars—represented by a curved line with dots for stars plotted along it.
Some cool stars lie above the main sequence. • Although they are cool, they are luminous. • So, they must be larger—have more surface area—than main-sequence stars of the same temperature.
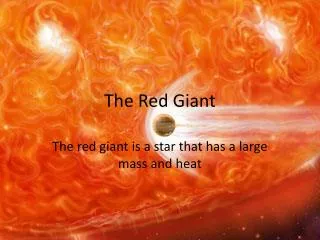
These are called giant stars. • They are roughly 10 to 100 times larger than the sun. • The supergiant stars at the top of the diagram are as large as 1,000 times the sun’s diameter.
Red dwarfsat the lower end of the main sequence are not only cool but also small, giving them low luminosities.
From main-sequence stars, we can derive a simple set of relationships I call “The Color Rule” Blue Stars Red Stars hot cooler bright dimmer massive less massive “burn” fast “burn” slow short lives long lives
In contrast, the white dwarfs lie in the lower left of the diagram. • Although they are hot, they are so small they have very little surface area from which to radiate. • That creates their low luminosities.
Note the dotted lines of star radius running diagonally across the diagram. White dwarf stars fall near the line labeled 0.01 RΘ. • They all have about the same radius as Earth!
Notice the great range of sizes. • The largest stars are 100,000 times larger than the tiny white dwarfs. • If the sun were a tennis ball, the white dwarfs would be grains of sand, and the largest supergiant stars would be as big as football fields.
A star’s spectrum contains clues to its size. • The larger a star is, the less dense its atmosphere. • The widths of spectral lines are partially determined by the density of the gas. • If the atoms collide often in a dense gas, their energy levels become distorted, and the spectral lines are broadened.
White dwarfs don’t enter into this classification. • Their spectra are very different from the other types of stars.
From spectral type and luminosity class, astronomers can estimate the star’s absolute magnitude (M), compare with its apparent magnitude (m), and compute its distance. • In the below equation, d = distance in parsecs: (1 parsec = 3.26 LY = 19.16 trillion miles) d = 10 0.2 (m - M + 5)
So… What can the the H-R diagram reveal about a star? (these are all approximations!) • Its distance • Its evolutionary (relative) age • Its size • Its mass • Its density • Its surface temperature