Download
1 / 1
10 likes | 70 Vues
Red Cell Distribution Width (RDW) Is a Strong Predictor of Outcome and Is Weakly Associated with Clinical Variables in Patients at Risk for Cardiovascular Events.

E N D
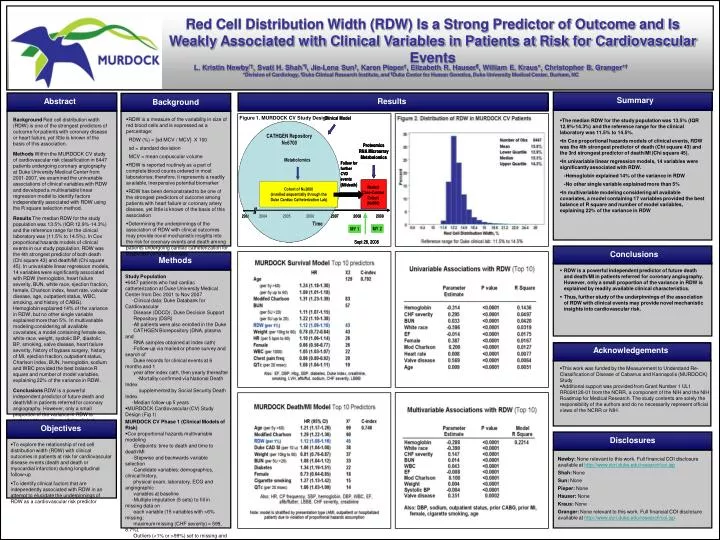
Red Cell Distribution Width (RDW) Is a Strong Predictor of Outcome and Is Weakly Associated with Clinical Variables in Patients at Risk for Cardiovascular Events L. Kristin Newby*†, Svati H. Shah*¶, Jie-Lena Sun†, Karen Pieper†, Elizabeth R. Hauser¶, William E. Kraus*, Christopher B. Granger*† *Division of Cardiology, †Duke Clinical Research Institute, and ¶Duke Center for Human Genetics, Duke University Medical Center, Durham, NC Summary Abstract Results Background Figure 1. MURDOCK CV Study Design • RDW is a measure of the variability in size of red blood cells and is expressed as a percentage: RDW (%) = [sd MCV / MCV] X 100 sd = standard deviation MCV = mean corpuscular volume • RDW is reported routinely as a part of complete blood counts ordered in most laboratories; therefore, it represents a readily available, inexpensive potential biomarker • RDW has been demonstrated to be one of the strongest predictors of outcome among patients with heart failure or coronary artery disease, yet little is known of the basis of this association • Determining the underpinnings of the association of RDW with clinical outcomes may provide novel mechanistic insights into the risk for coronary events and death among patients undergoing cardiac catheterization for suspected coronary disease Background Red cell distribution width (RDW) is one of the strongest predictors of outcome for patients with coronary disease or heart failure, yet little is known of the basis of this association. Methods Within the MURDOCK CV study of cardiovascular risk classification in 6447 patients undergoing coronary angiography at Duke University Medical Center from 2001-2007, we examined the univariable associations of clinical variables with RDW and developed a multivariable linear regression model to identify factors independently associated with RDW using the R square selection method. Results The median RDW for the study population was 13.5% (IQR 12.9%-14.3%) and the reference range for the clinical laboratory was (11.5% to 14.5%). In Cox proportional hazards models of clinical events in our study population, RDW was the 4th strongest predictor of both death (Chi square 43) and death/MI (Chi square 45). In univariable linear regression models, 14 variables were significantly associated with RDW (hemoglobin, heart failure severity, BUN, white race, ejection fraction, female, Charlson index, heart rate, valvular disease, age, outpatient status, WBC, smoking, and history of CABG). Hemoglobin explained 14% of the variance in RDW, but no other single variable explained more than 5%. In multivariable modeling considering all available covariates, a model containing female sex, white race, weight, systolic BP, diastolic BP, smoking, valve disease, heart failure severity, history of bypass surgery, history of MI, ejection fraction, outpatient status, Charlson index, BUN, hemoglobin, sodium and WBC provided the best balance R square and number of model variables, explaining 22% of the variance in RDW. Conclusions RDW is a powerful independent predictor of future death and death/MI in patients referred for coronary angiography. However, only a small proportion of the variance in RDW is explained by readily available clinical characteristics. Thus, further study of the underpinnings of the association of RDW with clinical events may provide novel mechanistic insights into cardiovascular risk. • The median RDW for the study population was 13.5% (IQR 12.9%-14.3%) and the reference range for the clinical laboratory was 11.5% to 14.5%. • In Cox proportional hazards models of clinical events, RDW was the 4th strongest predictor of death (Chi square 43) and the 3rd strongest predictor of death/MI (Chi square 45). • In univariable linear regression models, 14 variables were significantly associated with RDW. -Hemoglobin explained 14% of the variance in RDW -No other single variable explained more than 5% • In multivariable modeling considering all available covariates, a model containing 17 variables provided the best balance of R square and number of model variables, explaining 22% of the variance in RDW Conclusions Methods • RDW is a powerful independent predictor of future death and death/MI in patients referred for coronary angiography. However, only a small proportion of the variance in RDW is explained by readily available clinical characteristics. • Thus, further study of the underpinnings of the association of RDW with clinical events may provide novel mechanistic insights into cardiovascular risk. • Study Population • 6447 patients who had cardiac catheterization at Duke University Medical Center from Dec 2001 to Nov 2007 -Clinical data: Duke Databank for Cardiovascular Disease (DDCD), Duke Decision Support Repository (DSR) -All patients were also enrolled in the Duke CATHGEN Biorepository (DNA, plasma and RNA samples obtained at index cath) -Follow-up via mailed or phone survey and search of Duke records for clinical events at 6 months and 1 year after index cath, then yearly thereafter -Mortality confirmed via National Death Index supplemented by Social Security Death Index -Median follow-up 5 years • MURDOCK Cardiovascular (CV) Study Design (Fig 1) MURDOCK CV Phase 1 (Clinical Models of Risk) • Cox proportional hazards multivariable modeling -Endpoints: time to death and time to death/MI -Stepwise and backwards variable selection • -Candidate variables: demographics, clinical history, • physical exam, laboratory, ECG and angiographic • variables at baseline • -Multiple imputation (5 sets) to fill in missing data on • each variable (15 variables with >6% missing; • maximum missing (CHF severity) = 599, 8.7%). • Outliers (<1% or >99%) set to missing and imputed -Variables retained if p <0.05 -Continuous variables with non-linear relationships with outcome were transformed using restricted cubic splines -Proportional hazards assumption verified. Stratification used if proportional hazards assumption violated • Association of Clinical Variables with RDW • Univariable and multivariable linear regression -R square selection method used to identify set of variables to maximize R square with fewest possible variables -Candidate variables: demographics, clinical history, physical exam, laboratory, angiographic variables Acknowledgements • This work was funded by the Measurement to Understand Re-Classification of Disease of Cabarrus and Kannapolis (MURDOCK) Study • Additional support was provided from Grant Number 1 UL1 RR024128-01 from the NCRR, a component of the NIH and the NIH Roadmap for Medical Research. The study contents are solely the responsibility of the authors and do no necessarily represent official views of the NCRR or NIH. Objectives Objectives Disclosures • To explore the relationship of red cell distribution width (RDW) with clinical outcomes in patients at risk for cardiovascular disease events (death and death or myocardial infarction) during longitudinal follow-up • To identify clinical factors that are independently associated with RDW in an attempt to elucidate the underpinnings of RDW as a cardiovascular risk predictor Newby: None relevant to this work. Full financial COI disclosure available at http://www.dcri.duke.edu/research/coi.jsp Shah: None Sun: None Pieper: None Hauser: None Kraus: None Granger: None relevant to this work. Full financial COI disclosure available at http://www.dcri.duke.edu/research/coi.jsp