Download
1 / 58
650 likes | 940 Vues
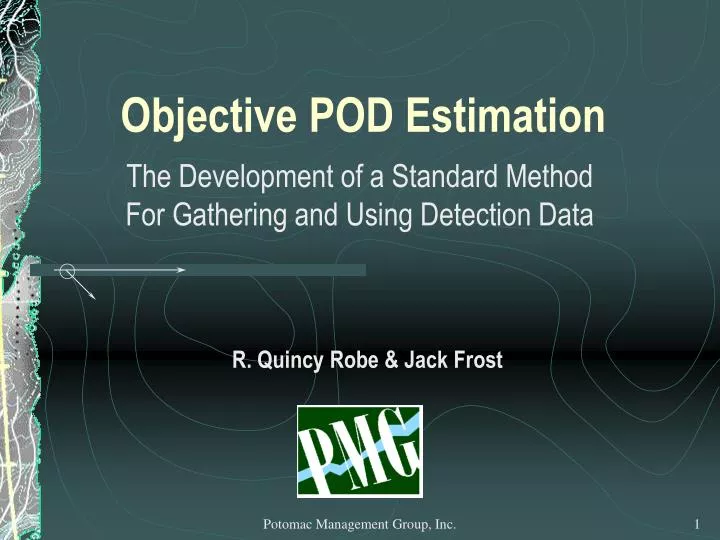
Objective POD Estimation. The Development of a Standard Method For Gathering and Using Detection Data. R. Quincy Robe & Jack Frost. Presentation Outline. Define and Describe a “detectability index” Show how it is used with other data to estimate POD

E N D
Objective POD Estimation The Development of a Standard Method For Gathering and Using Detection Data R. Quincy Robe & Jack Frost Potomac Management Group, Inc.
Presentation Outline • Define and Describe a “detectability index” • Show how it is used with other data to estimate POD • Describe a Procedure for doing detection experiments to determine a “detectability index” Potomac Management Group, Inc.
The Detection Process • A series of “glimpses” as the searcher moves through the environment containing the object. • Detection with any one “glimpse” depends on the • Search Object (size, color, contrast, etc.) • Environment (weather, terrain, vegetation, etc.) • Search Resource (sensor and platform) • Distance from the Resource to the Object Potomac Management Group, Inc.
What is Probability of Detection (POD)? • Applies to some amount of area (e.g., a segment) • Probability of detecting an object if present • POD is a function of: • Effort (Resources, Search Speed, Time) • Size of the Area covered • Search object “detectability” Potomac Management Group, Inc.
What is Effort? • Total Distance traveled by searchers while searching in the segment • Effort = searcher speed x time x number of searchers What is Area covered? • Size of the area over which the searching effort is approximately uniformly spread Potomac Management Group, Inc.
What is Detectability? • How can one measure or quantify how easy or hard it will be to detect a particular object with a particular type of resource (sensor) in a particular environment? Potomac Management Group, Inc.
What about Maximum Detection Range? • Easy to measure directly. • Measures how far from the sensor an object can be detected by an alerted searcher who knows where to look. • Does not address whether the object will be detected within that range. • Does not measure how much detecting can be expected from a searcher (sensor). • No simple, predictable correlation with detection performance. Potomac Management Group, Inc.
What about direct estimation? • Humans are very poor at estimating probabilities of any kind. • Compare: • How many of 10 objects would you have found? • How many of 10 objects could you have missed? • No such thing as “one size fits all” POD for everything from small clues to large objects. • Direct estimation = Wild Guess Potomac Management Group, Inc.
Effective Sweep Width (Koopman) • Cannot be measured directly • Is an objective measure of detectibility • Large value => easy to detect • Small value => hard to detect • Depends on the characteristics of • Searcher/Sensor (What we are searching with.) • Search Object (What we are searching for.) • Environment (What we are searching in.) • Terrain, Vegetation, Weather, etc. • Has units of length (feet, meters, miles, etc.) Potomac Management Group, Inc.
A Uniform Random Distribution Potomac Management Group, Inc.
Effective Sweep Width Effective Sweep Width (Unrealistic Ideal Sensor Making a Clean Sweep) Number detected = 40. Number missed within sweep width = 0. Number detected outside sweep width = 0. Potomac Management Group, Inc.
Effective Sweep Width Max Detection Range Effective Sweep Width (More Typical Sensor) Number detected = 40. Number missed within sweep width = 16. Number detected outside sweep width = 16. Potomac Management Group, Inc.
Effective Sweep Width Notes • In both of the previous examples, there were • The same object density (# of objects/unit of area), • The same length of searcher track, and • The same number of objects detected (40). • Therefore, • The effective sweep widths are also the same. • Effective sweep width represents the expected amount of detection. Potomac Management Group, Inc.
Lateral Range (Koopman) • Distance to right or left of sensor at the closest point of approach (CPA) • Lateral range curve Potomac Management Group, Inc.
Effective Sweep Width • Key to Improved Search Planning and Evaluation • Improves POD Estimation • Allows us to Objectively Relate POD to Effort Expenditure • Has both Predictive and Retrospective Value • More Accurate and Reliable than Subjective Estimates • Based on Observable Factors • Improves Effort Allocation • Makes known, proven (mathematical) techniques available • Improves conceptualization of the search problem Potomac Management Group, Inc.
Objective POD EstimationFor a searched segment • Effort = z = Total Distance Searchers Cover = search speed time number of searchers • Effective Sweep Width = W from detection experiments • Area Effectively Swept = zW • Coverage = C = • POD = 1 – e-C(Koopman) Area Effectively Swept Area of Searched Segment Potomac Management Group, Inc.
POD versus Coverage POD vs. Coverage Graph (Koopman) Potomac Management Group, Inc.
“Uncorrected” Effective Sweep WidthsIn Nautical Miles For Aerial Search Over Land (IAMSAR Manual) Potomac Management Group, Inc.
Effective Sweep Width Correction FactorsFor Aerial Search Over Land (IAMSAR Manual)(Multipliers) Potomac Management Group, Inc.
Sweep Width Issues for Ground Search • Too many different types and combinations of terrain, vegetation, search objects for a “universal” set of sweep width tables. • Each locale needs sweep widths only for its area of responsibility, typical search objects, etc. • Solution: Develop a standard, practical, and scientifically based procedure for local resources to use when developing sweep width estimates. Potomac Management Group, Inc.
The Logan, West VirginiaDemonstration Project Potomac Management Group, Inc.
Project Support • Sponsored by the U. S. National Search and Rescue Committee (NSARC) • Funded by Department of Defense (NSARC member) • Contract administered by U. S. Coast Guard (NSARC Chair) via the USCG Research and Development Center; performed by Potomac Management Group • Endorsed by NASAR and U. S. Air Force RCC • Hosted by Logan Emergency Ambulance Service Authority Potomac Management Group, Inc.
Demonstration Project • Principal Investigator: R. Quincy Robe • Location: Chief Logan State Park, Logan, WV • Host: Roger Bryant, Director, Logan Emergency Ambulance Service Authority (LEASA) • Participants: Attendees at Logan SAR Weekend on 15-16 June 2002 • Outstanding support and hospitality! Potomac Management Group, Inc.
Demonstration Project Objectives • Design Practical Detection Experiment Procedures to determine Effective Sweep Width values for ground wilderness/rural searches. • Supervise a Demonstration of the Procedures Using Ground SAR Personnel. • Describe Method for Objectively Estimating POD from Effective Sweep Width, Effort, and Area. • Report Results and Describe Future Work required to generalize their application. Potomac Management Group, Inc.
Concept of Operations (Preparation) • Select a typical area and typical search object types (no more than 3 types) • Select track(s) for searchers to follow (for at least 1 hour—longer is better) • Choose date, select participants, make logistic arrangements, set up schedule • Obtain/construct search objects (≥ 10 of each) Potomac Management Group, Inc.
Concept of Operations (Execution) • Place objects at random locations along the track and random distances on either side • Send searcher/data recorder pairs along the track at timed intervals (to ensure separation) • Searchers move at normal search speed and report all sightings of search objects • Data recorders record searcher sighting reports and other pertinent data • Collect and analyze the recorded data Potomac Management Group, Inc.
Experiment Area Chief Logan State Park Potomac Management Group, Inc.
h g f 290 m 340 m 80 m End II 280 m End I e 230 m 240 m a d 220 m 220 m b c 180 m Waypoints a to h were marked with flags. Approximate distances between waypoints are in meters. Select Search Track Potomac Management Group, Inc.
Search Objects Orange Glove Garbage Bag Potomac Management Group, Inc.
Determining Object Locations • Useful range of distances off track • Too close => Insufficient data for longer ranges • Too far => Wasted detection opportunities • Useful range of distances along track • Too close => Frequent reinforcement => alertness • Too far => Track too long for reasonable time • Use Average Maximum Detection Range Potomac Management Group, Inc.
AMDR Leg 3 Leg 4 Leg 2 Detection Range Leg 5 Leg 1 Leg 8 Leg 6 Leg 7 Envelope of Maximum Detection Range The eight values used to compute the AMDR are the distances from the search object to the eight intersections of the envelope with the the Legs Average Maximum Detection Range Potomac Management Group, Inc.
Select Object Placement • Randomize • Distances along the track • Distances off track • Right or Left of track • Object types • Determine locations based on largest AMDR • Average separation along track of 3 AMDR • Off track up to 1.5 AMDR Potomac Management Group, Inc.
Example of Object Locations(AMDR = 100 m) Potomac Management Group, Inc.
3 x AMDR 1.5 xAMDR Lateral Range 1.5 xAMDR 2 x AMDR Search Object Location Zones Potomac Management Group, Inc.
What is a Detection Opportunity? • For the purposes of a detection experiment, a detection opportunity is defined as one complete pass by the search object. • If there are 15 identical search objects of a given type and 30 searchers in an experiment, then there are a total of 15 x 30 = 450 detection opportunities for that type. • Each detection opportunity has one of two results: Detection or Non-detection. Potomac Management Group, Inc.
Important Notes When performing a detection experiment, it is important to understand that: • The relationship between the searcher (sensor) and the search object during the window of detection opportunity must be captured, and • Knowing when non-detection occurs is just as important as knowing when detection occurs. Potomac Management Group, Inc.
Important Notes • The experiment is NOT a competitive event • The experiment does NOT measure individual searcher proficiency • Do NOT tell searchers how many objects are present, how far off track, or give any other hints • DO Collect additional data (e.g., weather, time of day, terrain and vegetation descriptions, searcher training/experience data, etc.) for later analysis Potomac Management Group, Inc.
Perform Experiment • Secretly Place Objects at Selected Locations • Send Searcher/Data Recorder Pairs along the Selected Track at Timed Intervals • Collect Completed Detection Data Forms • Remove Objects at Experiment’s Conclusion (Discard data for objects not found.) • Compile, Sort and Analyze the Detection Data Potomac Management Group, Inc.
Detection Log Potomac Management Group, Inc.
Calculate Sweep Width • Use the following property of sweep width: • The number of detections outside a swath one sweep width wide centered on the searcher’s track equals the number of missed detections inside that swath. • Equivalently, the number of detections at lateral ranges greater than one-half the sweep width value are equal to the number of missed detections at lateral ranges less than one-half the sweep width value. Potomac Management Group, Inc.
Logan Demonstration Statistics • 32 Searchers Participated • 12 Orange Gloves were placed Glove AMDR = 19 meters 32 x 12 = 384 Detection Opportunities • 9 Black Garbage Bags were placed Bag AMDR = 25 meters (1.5 x 25 = 37.5 meters) 32 x 9 = 288 Detection Opportunities Potomac Management Group, Inc.
Consolidated Detection Data Potomac Management Group, Inc.
Orange Glove Detection Data—W = 36 meters. (Crossing point equals one-half effective sweep width value.) (AMDR = 25 m) (12 Gloves, 32 Searchers) Orange Glove Sweep Width Potomac Management Group, Inc.
Orange Glove Half Lateral Range Curve—W = 40 meters (Areas under this portion equal one-half effective sweep width value.) Orange Glove Half Lateral Range Curve Potomac Management Group, Inc.
Modified Orange Glove Detection Data—W = 33 meters. (Crossing point equals one-half effective sweep width value.) Orange Glove Modified Sweep Width Potomac Management Group, Inc.
Modified Orange Glove Half Lateral Range Curve—W = 33 meters. (Areas under this portion equal one-half effective sweep width value.) Orange Glove Modified Half LRC Potomac Management Group, Inc.