Download
1 / 20
200 likes | 318 Vues
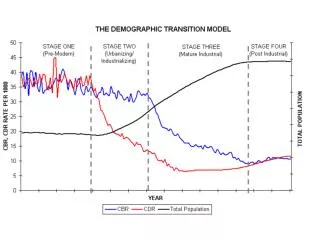
Demographic Transition Model. Population Change in England and Wales 1700-2000. Population Change. Outputs. Inputs. Deaths. Births. Natural Increase. Total Population. Emigrants. Immigrants. Migration.

E N D
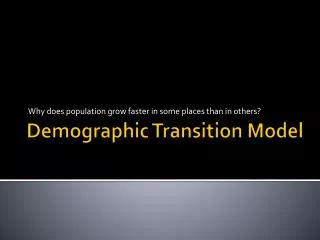
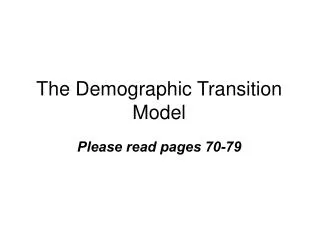
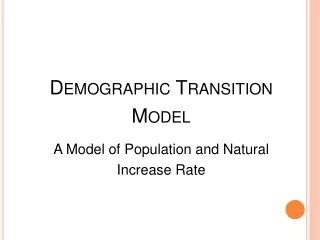
Demographic Transition Model
Population Change Outputs Inputs Deaths Births Natural Increase Total Population Emigrants Immigrants Migration The total population of an area is the balance between 2 forces of change: natural increase and migration Natural increase is the balance between birth rates and death rates
Doubling Time This map shows how long it will take for countries to double their population if it continued to grow at the present rate
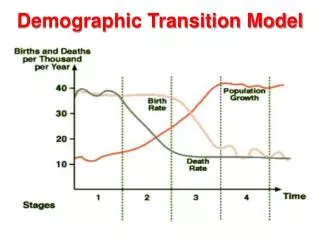
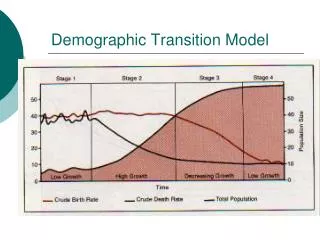
Demographic Transition Model Stage 1 Stage 2 Stage 3 Stage 4 Stage 5 ? Total Population Natural Increase In Population Natural Decrease In Population Birth Rate Death Rate
Stage 1High Fluctuating • Low population • Increasing very slowly • High birth rate • High death rate • Tribes (Amazonia) • UK: pre-1780 Stage 1 Birth Rate Death Rate Total Population
Stage 2Early Expanding Stage 2 • Population growing at faster rate • High but decreasing birth rate • Decreasing death rate • Sri Lanka/Bolivia • UK: 1780-1880 Birth Rate Death Rate Total Population
Stage 3Late Expanding Stage 3 • Population still increasing, but rate of increase slowing down • Decreasing birth rate • Low death rate • Uruguay/China • UK: 1880-1940 Total Population Birth Rate Death Rate
Stage 4Low Fluctuating Stage 4 • High population, almost stable • Low birth rate • Low death rate • Canada/USA • UK: post-1940 Total Population Birth Rate Death Rate
Demographic Transition Model Stage 1 Stage 2 Stage 3 Stage 4 Total Population Natural Increase In Population Natural Decrease In Population Birth Rate Death Rate Ethiopia/ Niger UK: pre-1780 Sri Lanka/ Bolivia UK: 1780-1880 Uruguay/ China UK: 1880-1940 Canada/ USA UK: Post-1940
Reasons What do you think the reasons are for the changes at each stage?
Reasons for Stage 1High Fluctuating • Little access to birth control • Many children die in infancy so parents have more to compensate • Children are needed to work on the land • Some religions encourage large families • Death rates are high due to disease, famine, poor diet, poor hygiene, little medical science Stage 1 Birth Rate Death Rate Total Population
Reasons for Stage 2Early Expanding Stage 2 • Improvements in medical care • Improvements in sanitation and water supply • Quality and quantity of food produced improves • Transport and communications improve movements of food and medical supplies • Decrease in infant mortality Birth Rate Death Rate Total Population
Reasons for Stage 3Late Expanding • Increased access to contraception • Lower infant mortality rates so less need for bigger families • Industrialisation and mechanisation means fewer labourers required • As wealth increases, desire for material possessions takes over the desire for large families • Equality of women means they can follow a career rather than just staying at home Stage 3 Total Population Birth Rate Death Rate
Reasons for Stage 4Low Fluctuating Stage 4 • Rates fluctuate with ‘baby booms’ and epidemics of illnesses and diseases • Reasons for Stage 4 have improved and it stabilises Total Population Birth Rate Death Rate
Is there a Stage 5? ? ? ? Stage 5: Declining (or Depleting) Population
Limitations What limitations do you think there could be with the model? • It does not include the influences of migration • It assumes that all countries will go through the same pattern • There is no time scale • Reasons for birth rates and death rates are very different in different countries • And finally, is there a stage 5?